Sample Test Page
April 4, 2021
This page is a temporary page to test the time it takes to upload (51) thumbnail charts simultaneously using a Squarespace Gallery element.
Each graphic was published in a square format at 400 X 400 px.
Each graphic was exported in PNG-format from the charting application at 144 dpi resolution.
Each published graphic is approximately 112 KB in size.
The total time to upload all (51) charts, including the time taken to set up the table parameters, was approximately 52-seconds.
The actual uploading time of all charts via a cable modem connection in April 2021 was approximately 10-seconds. The rest of the time was spent (a) editing the table parameters and design options; and (b) opening the folder where the graphics were stored, selecting all, and selecting the upload button on the Squarespace screen upload utility.
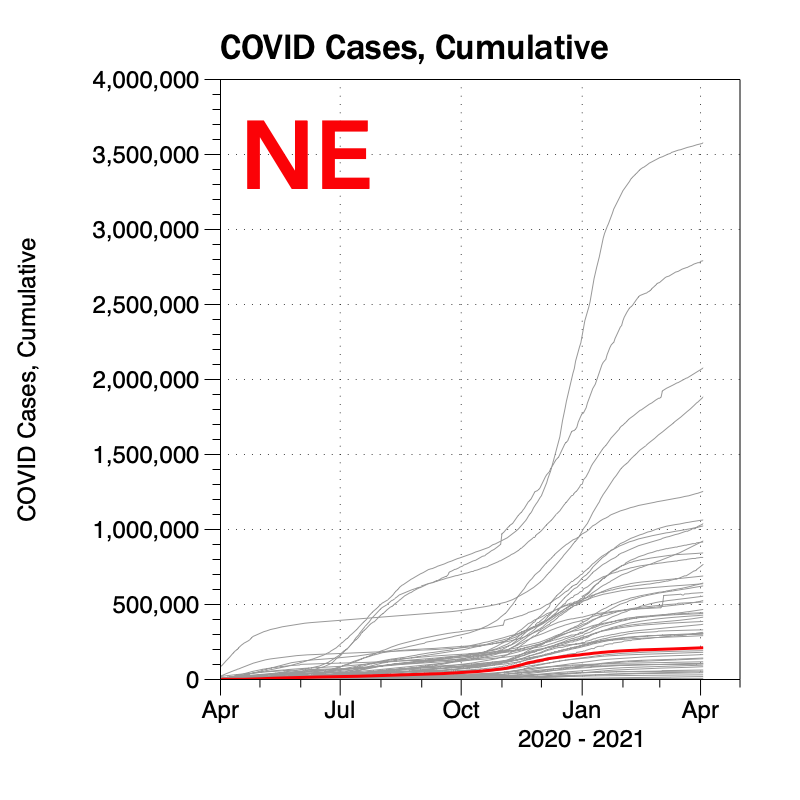
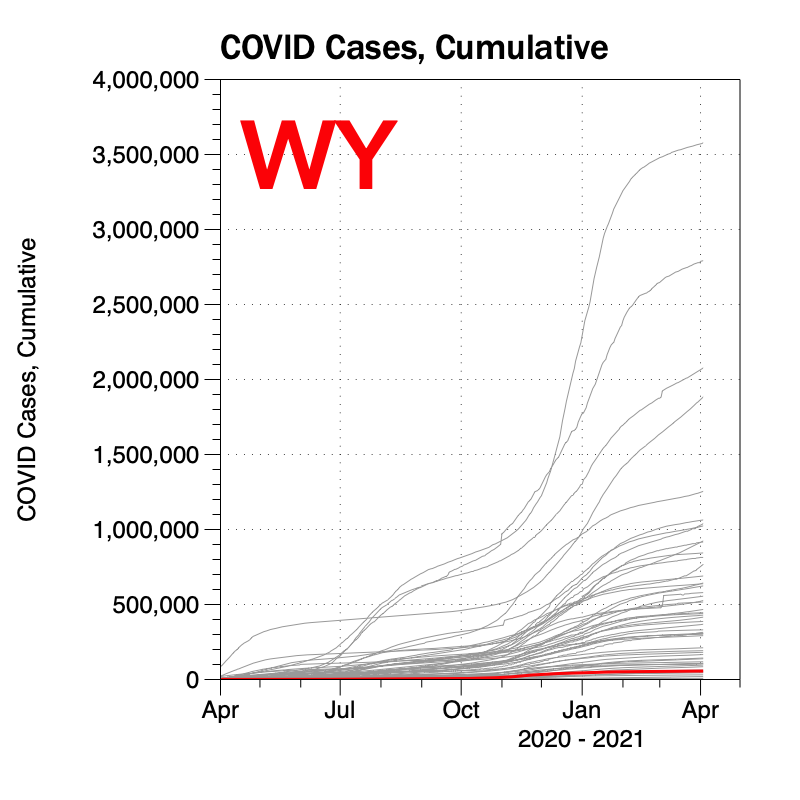
Cumulative COVID Cases, U.S. States and the District of Columbia
Click on any state chart to expand.


Data Sources (unless indicated differently):
John Hopkins University Medicine | Coronavirus Research Center
Data Graphics Software (unless indicated differently):
Visual Data Tools, Inc. DataGraph 4.6.1 for macOS.
Chart Design: © David Blackwell, Seattle, 2021. Please contact for permission to use: https://www.litterrocks.com/contact