
Total Vaccination Shots, Cumulative
The state charts below show the total number of vaccine shots administered over time whether these are first shots or second shot. These numbers are strict counts accumulated over time and they are not adjusted for populations. Therefore, states with the largest populations generally show the greatest number of shots administered.
February 22, 2022
Data thru February 21, 2022, unless otherwise noted on chart.
Return to the Covid Index page.


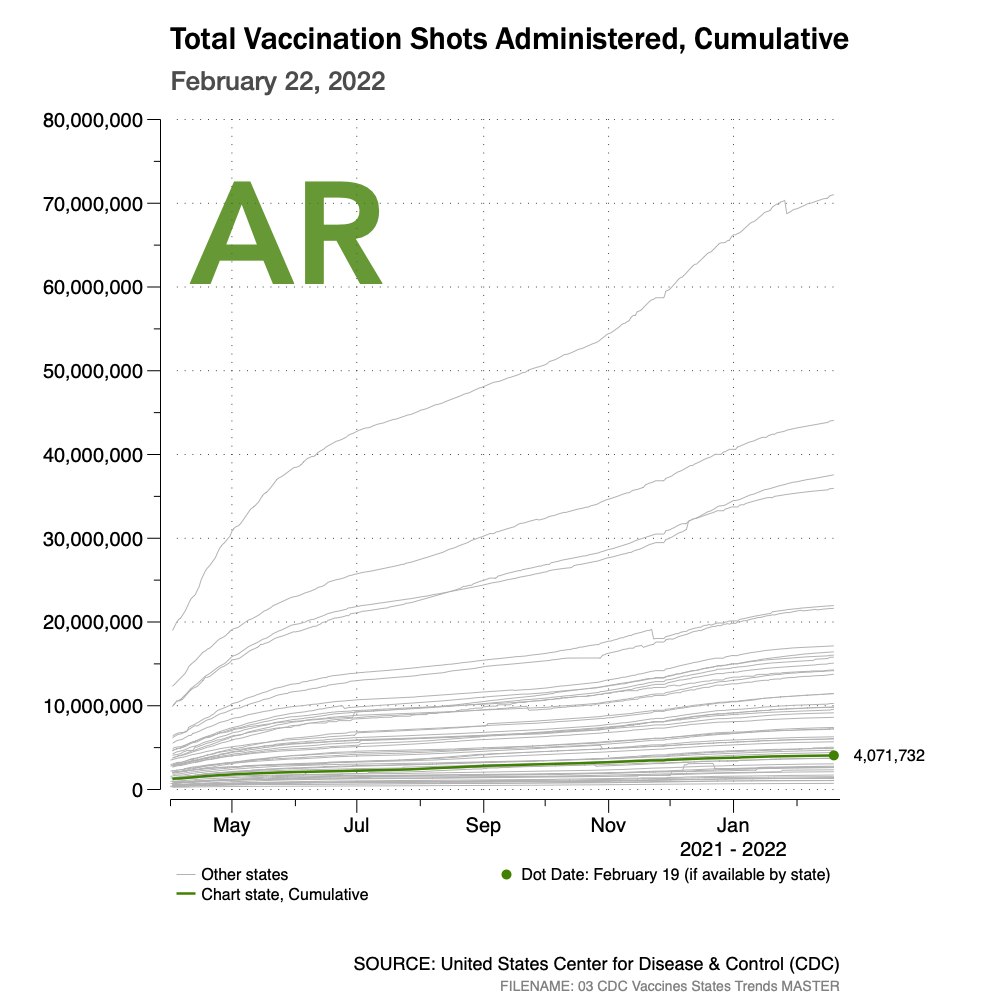


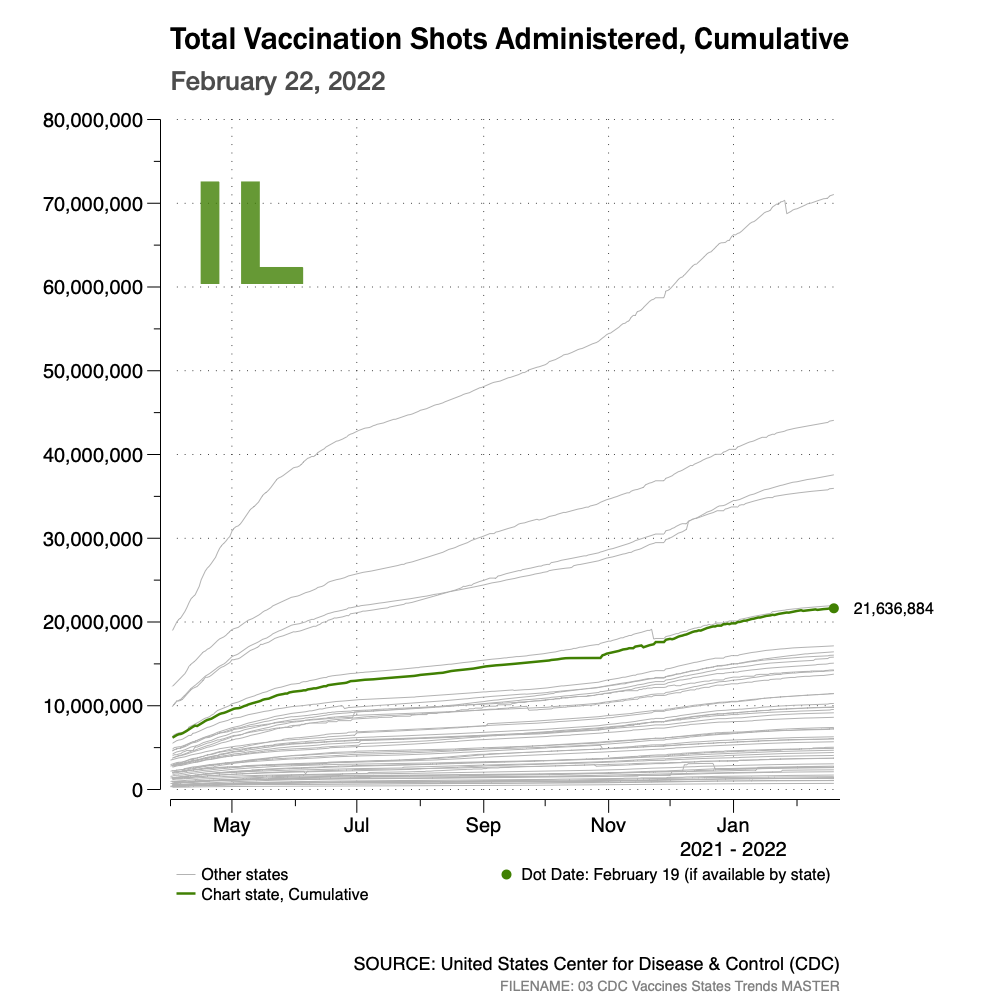


The vaccine data is provided by the United States Center for Disease Control and Prevention (CDC).