
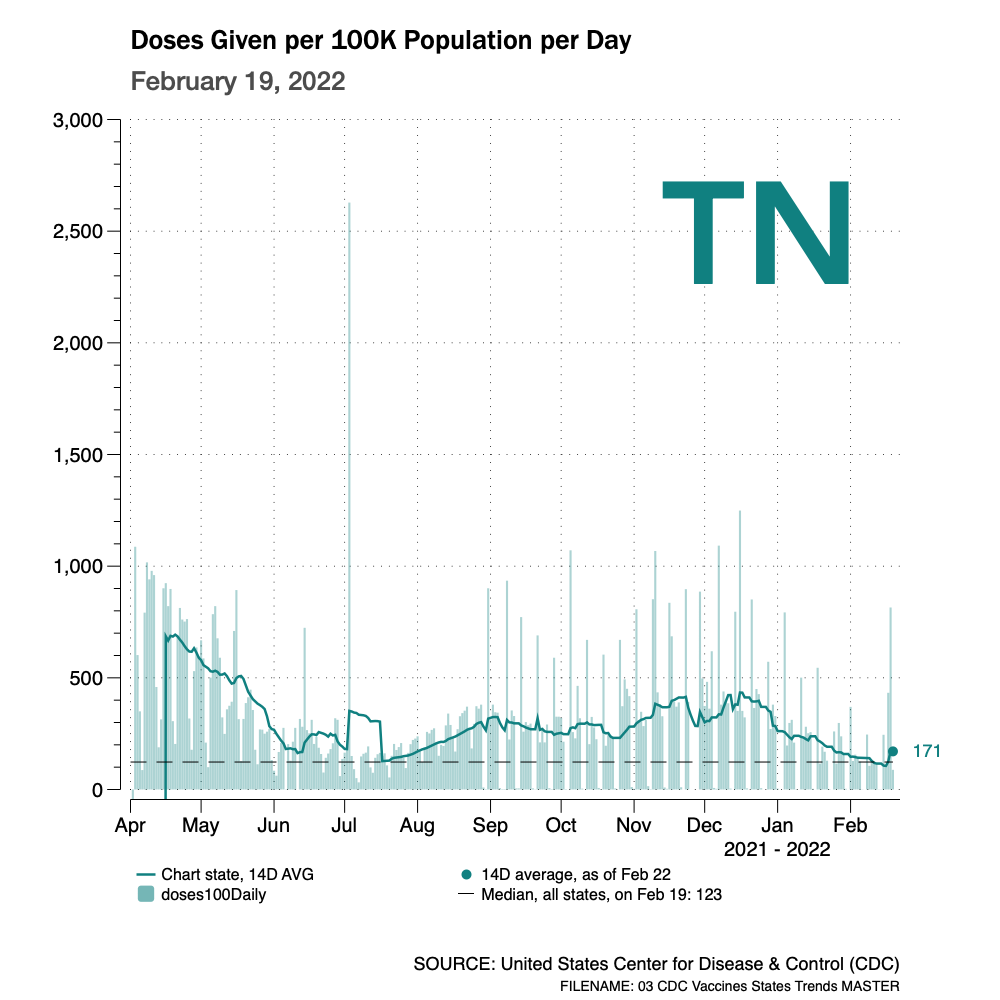
Total Number of Vaccine Doses Given Daily per 100K (Population)
February 22, 2022
Data thru February 22, 2022, unless otherwise noted on chart.
Return to the Covid Index page.
The following charts show the total number of COVID vaccine shots administered daily for each state and the District of Columbia. The state names are initialized and are presented in alphabetical order.
Each state’s blue curve is smoothed over a 14 day period.
Click on any individual chart to expand it.


keywords: United States, U.S., COVID, vaccinations, doses, per capita, daily
Data Source:
The vaccine data is provided by the United States Center for Disease Control and Prevention (CDC).