
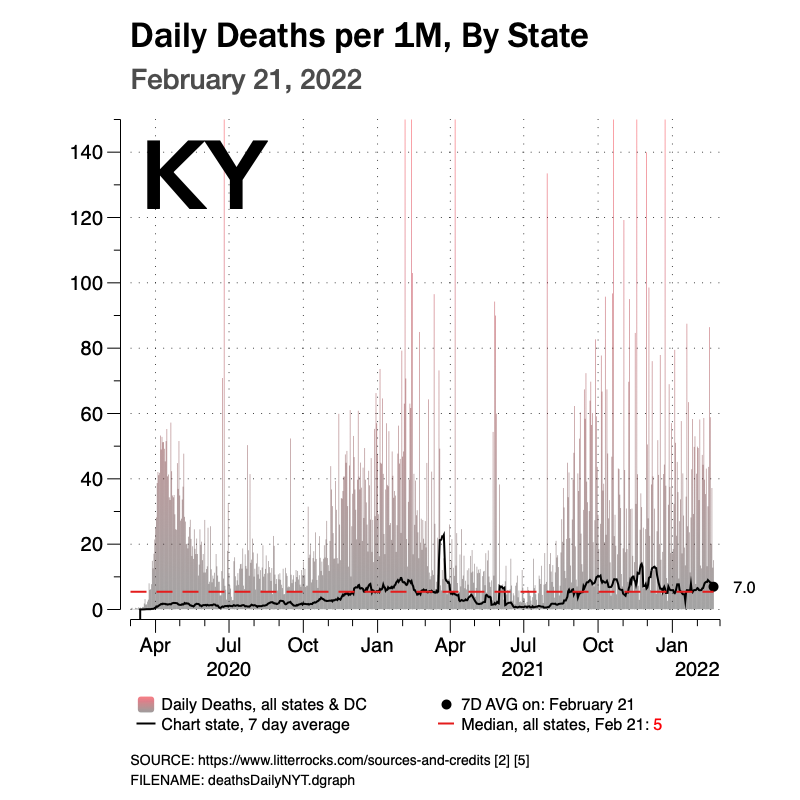
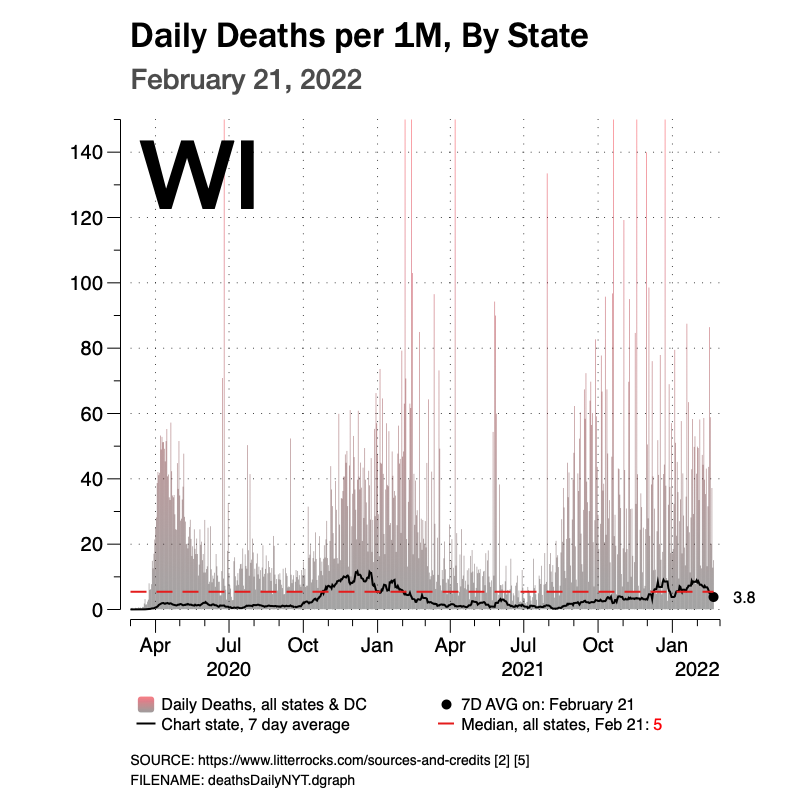
COVID Deaths per 1M Population, Daily
February 22, 2022
Data thru February 21, 2022, unless otherwise noted on chart.
Return to the Covid Index page.
The following charts show time-series analyses of deaths per capita due to COVID-19. The per capita rate shown is deaths per 1M population. Most states have shown a sharp decline since late winter and since more Americans have received vaccinations.
Michigan had a well-documented rise in cases in mid-spring 2021. That rise in cases shows a comparable rise in death rates during this same period. But, this rise in death rates appears to be abating as well.
**
Note:
Short spikes in data of 1-2 days generally reflect corrections made to state totals by state agencies. Plotting smoothed data is designed to minimize this effect, but some corrections are large enough to create spikes.


Data Source:
U.S.-level COVID data for cases & deaths on some charts is provided by The New York Times, based on reports from state and local health agencies. It is used in accordance with The New York Times and with the Creative Commons Attribution-NonCommercial 4.0 International license.
The state populations used for calculating per capita rates were obtained from the United States Census Bureau. The most recent full year values listed were for July 1, 2019 at the time of this writing. A link to the source data is here.