
States: COVID Testing, Daily
February 22, 2022
Data thru February 21, 2022, unless otherwise noted on chart.
Return to the Covid Index page.
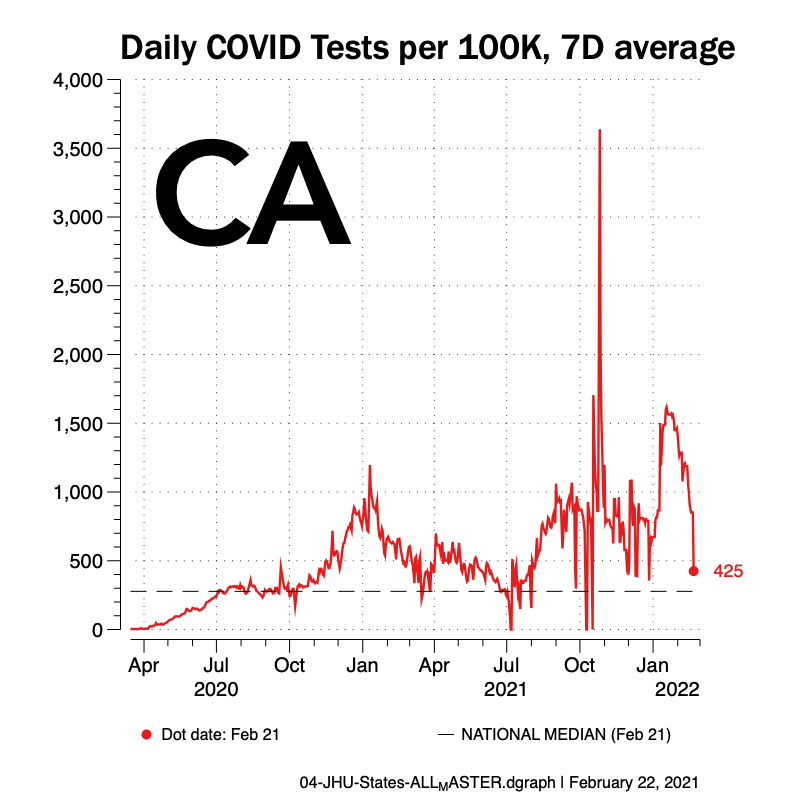
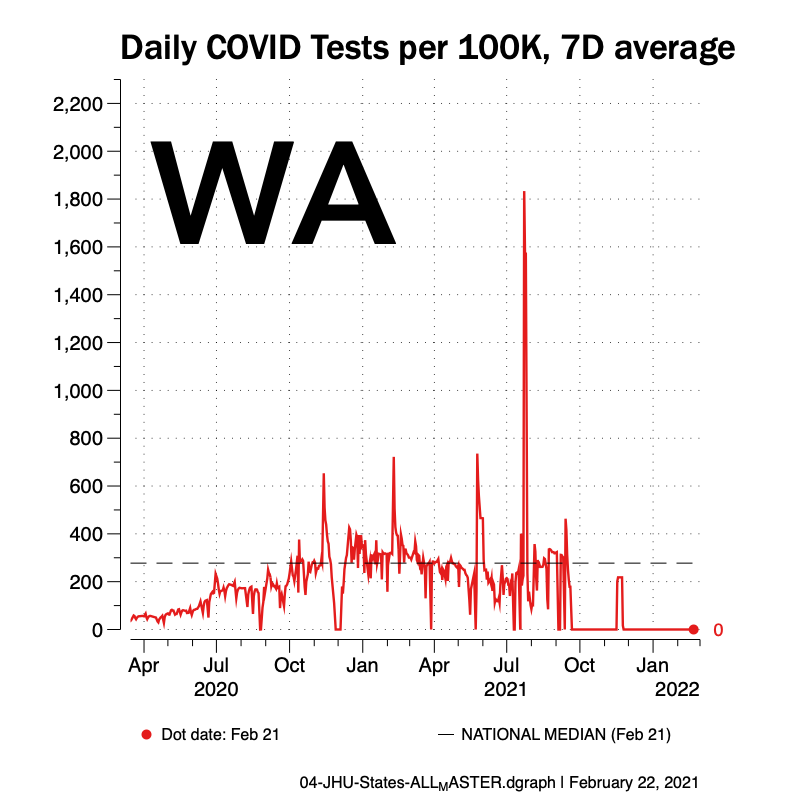
The following charts show the 7-day average of daily testing for COVID-19 for each state and the District of Columbia. The state names are initialized and are presented in alphabetical order.
Not all states report testing in an identical manner and this complicates compiling testing data. Some of the charts below appear to show no testing. The underlying data for these charts is currently being reviewed to adapt for the states which report test data in an alternative manner.


keywords:
covid, covid-19, states, u.s., comparisons, new testing, rate of change, daily
DATA SOURCES:
The COVID data is provided by John Hopkins University (JHU) School of Medicine and used in accordance with a Creative Commons CC BY 4.0 License.
Prior to JHU, the COVID data was provided by the COVID Tracking Project (CTP) at The Atlantic and used in accordance with a Creative Commons CC BY 4.0 License. The CTP ceased updating data on March 7, 2021. Further updates were continued by JHU.