States: 1. COVID, Testing vs. Positive Returns
Data last updated: April 4, 2021
Text last updated: April 7, 2021
Notice, 4/5: Updates have restarted for specific data sets with new data supplemented by John Hopkins University School of Medicine. For further information, please click here.
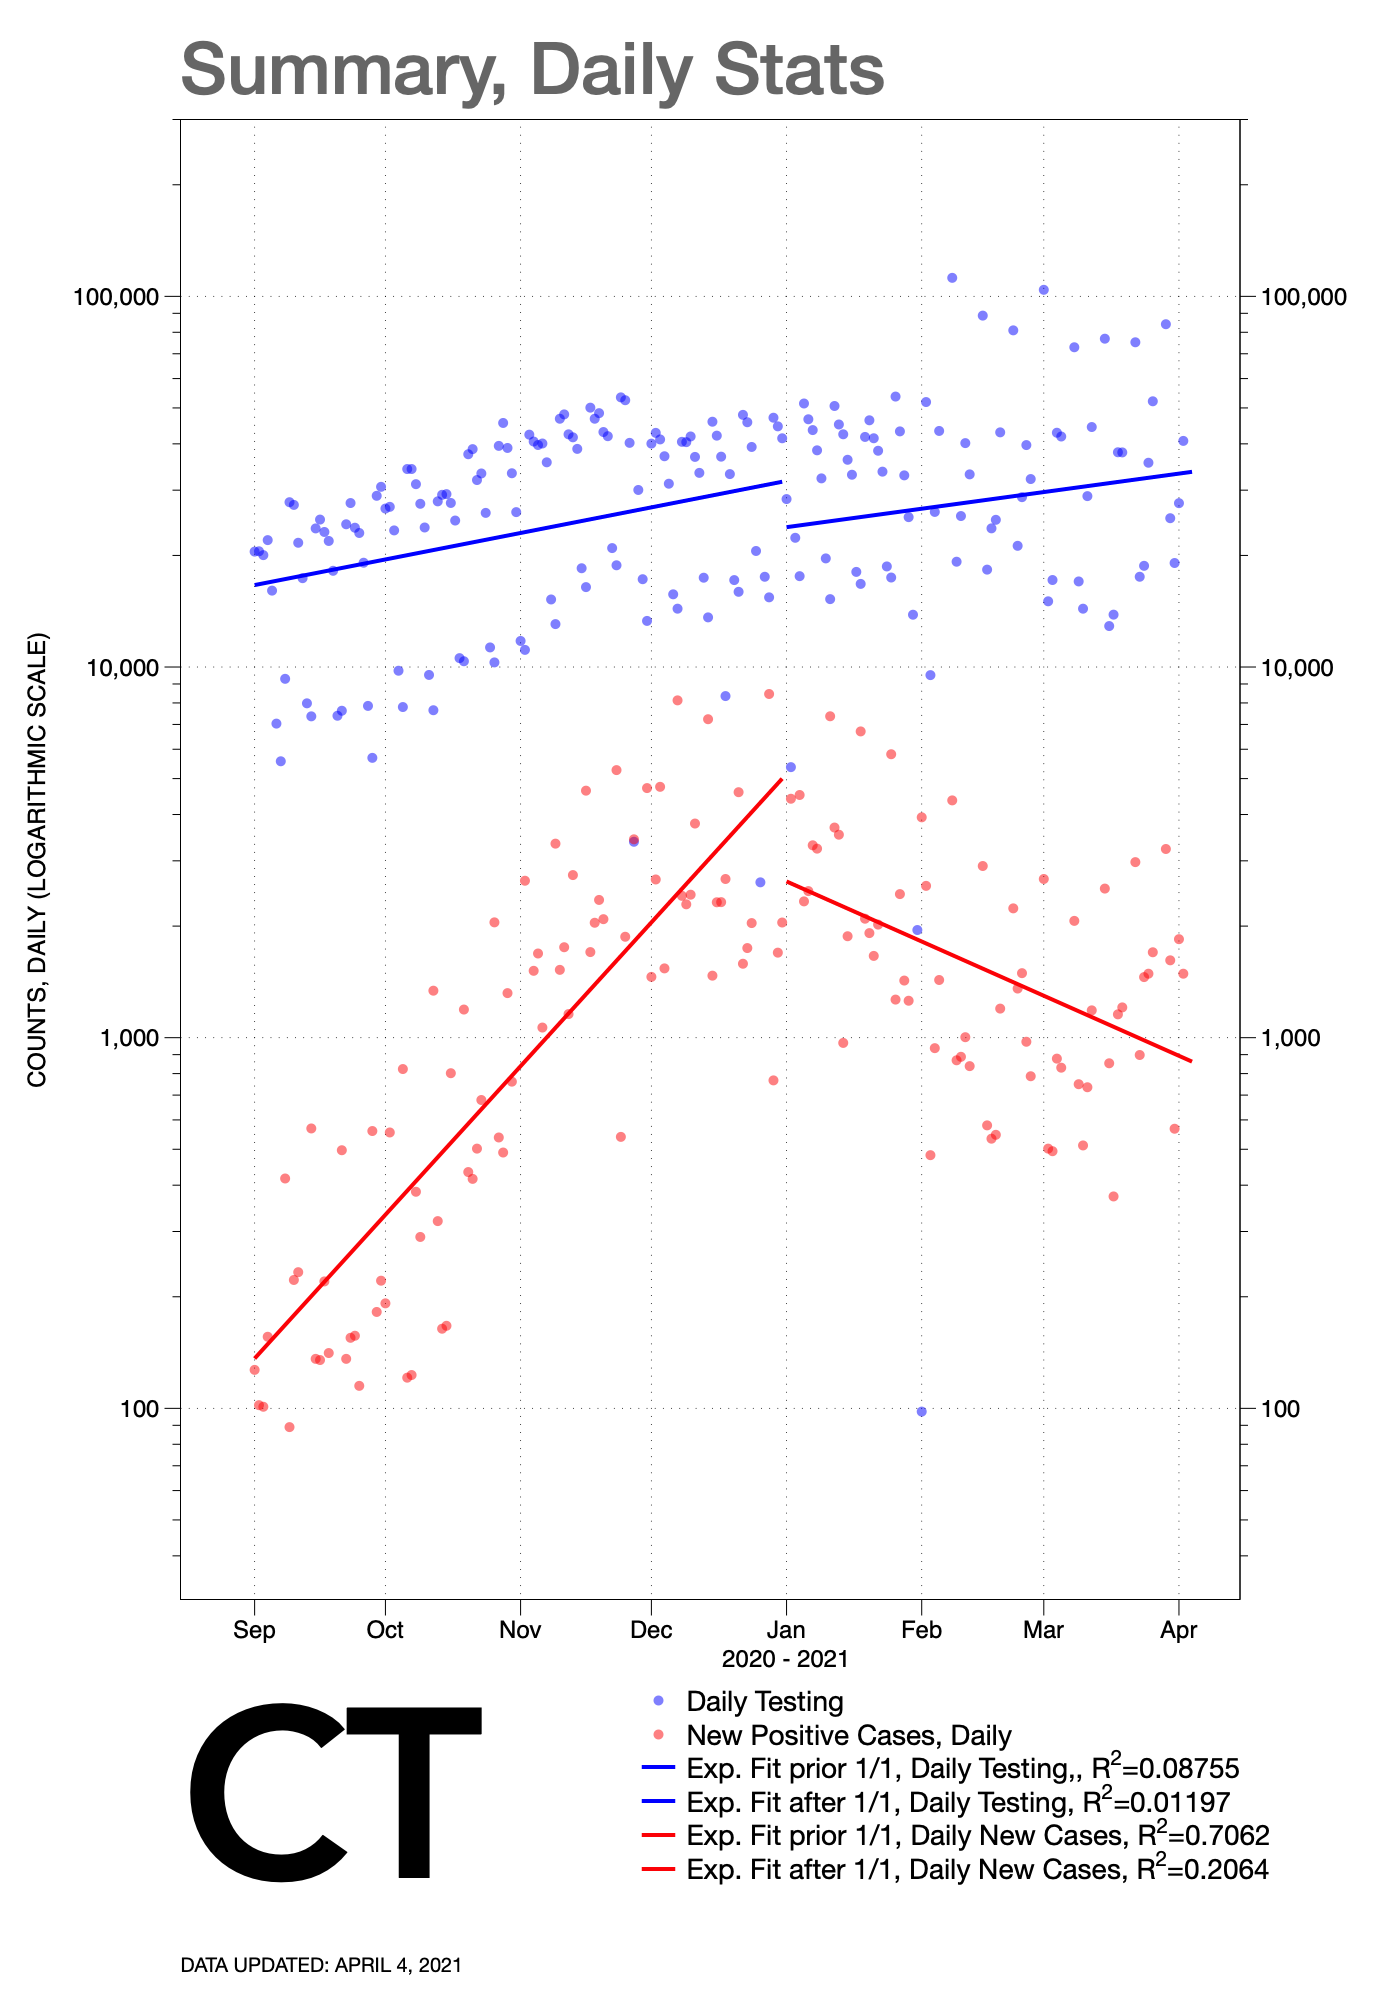
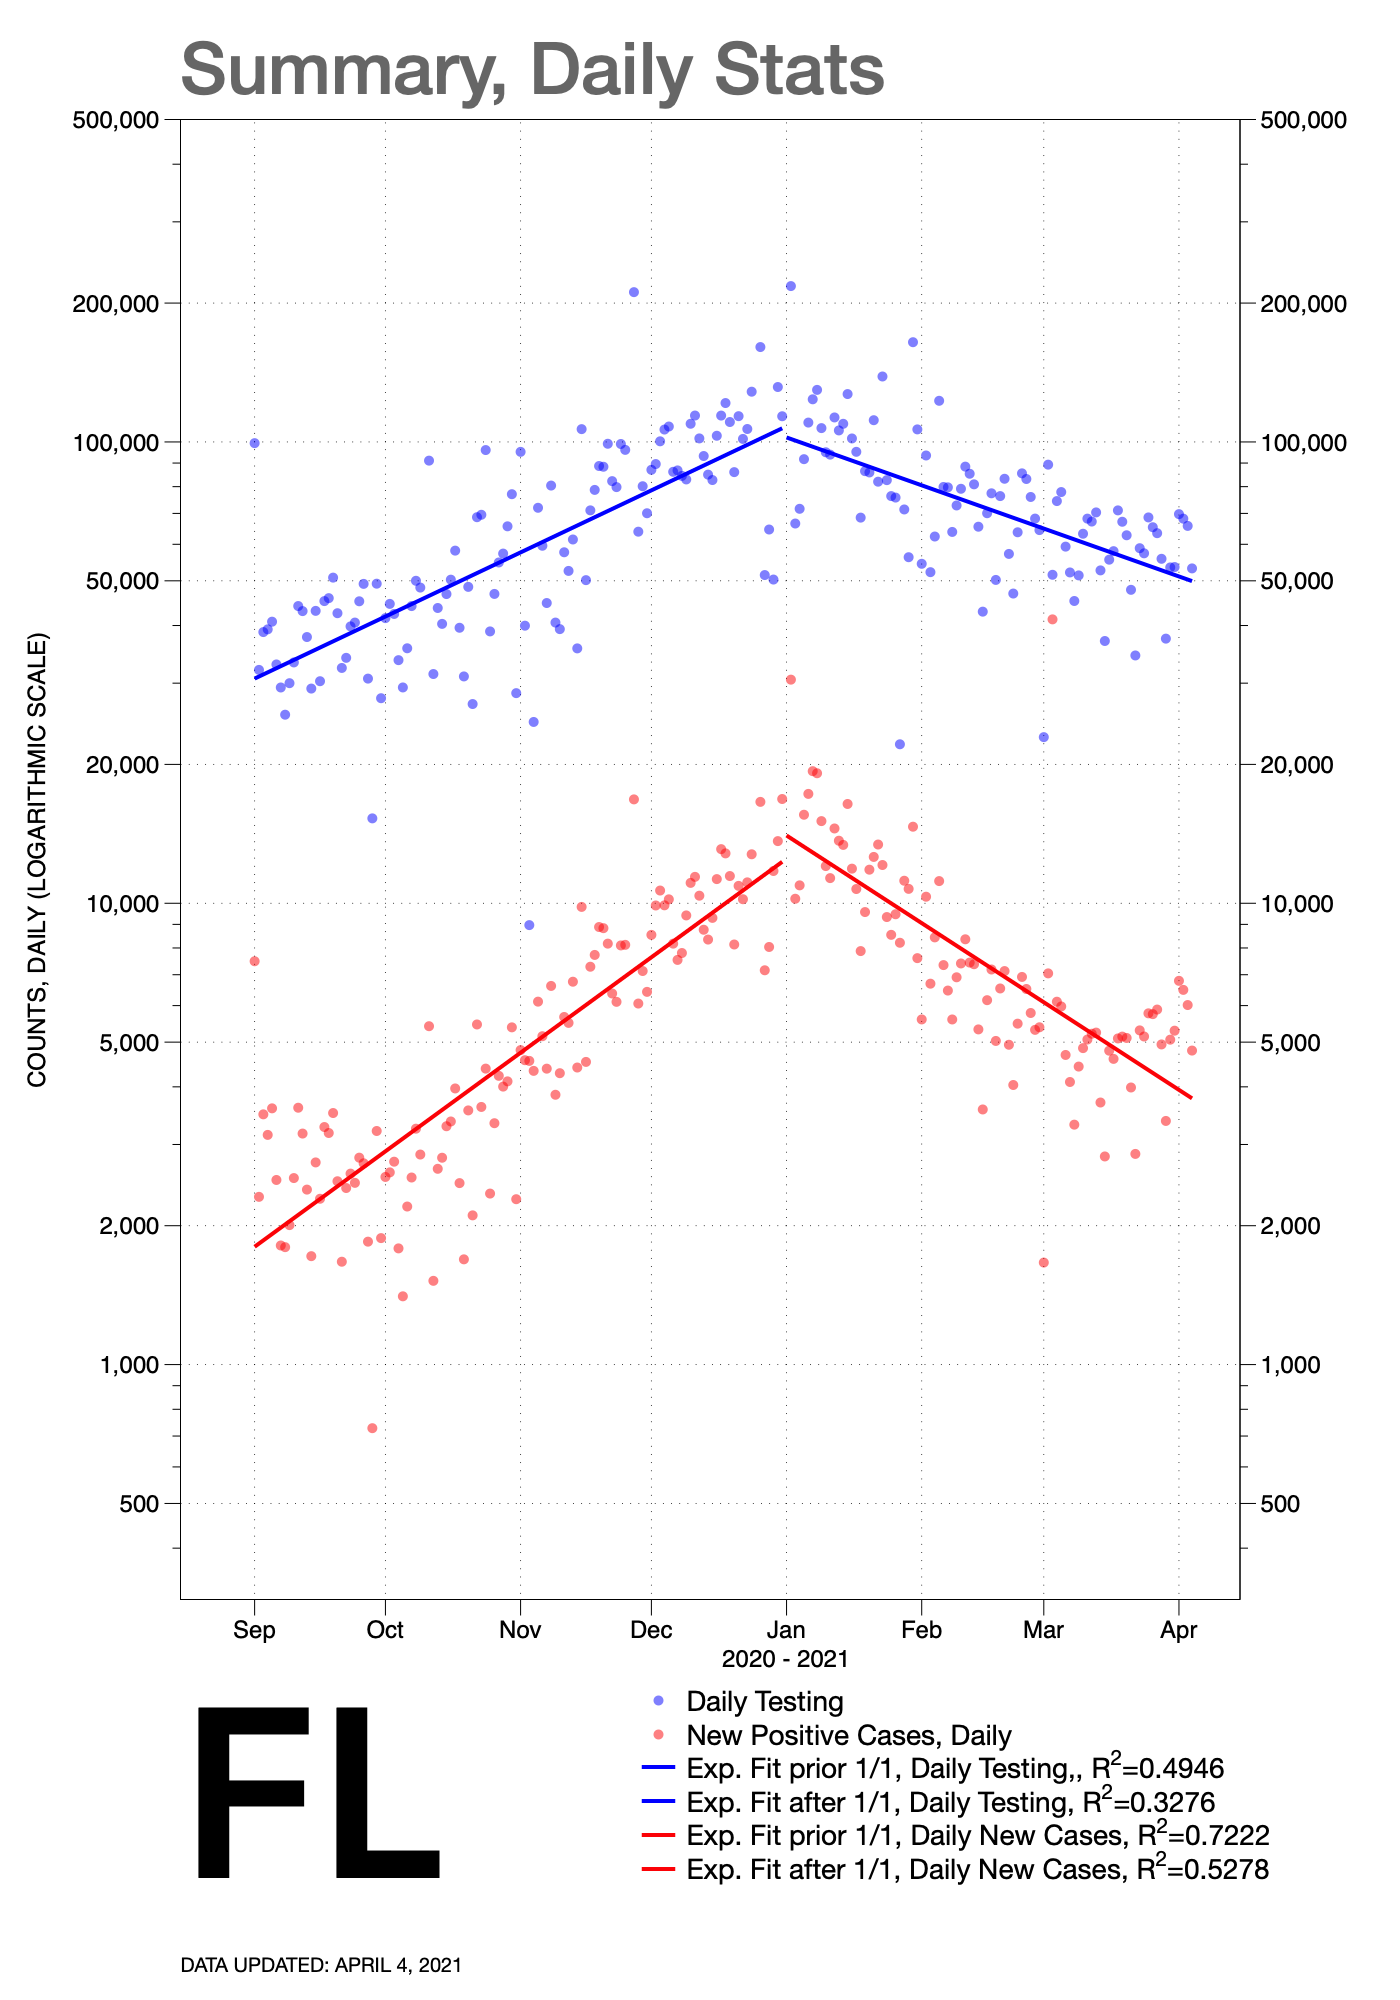
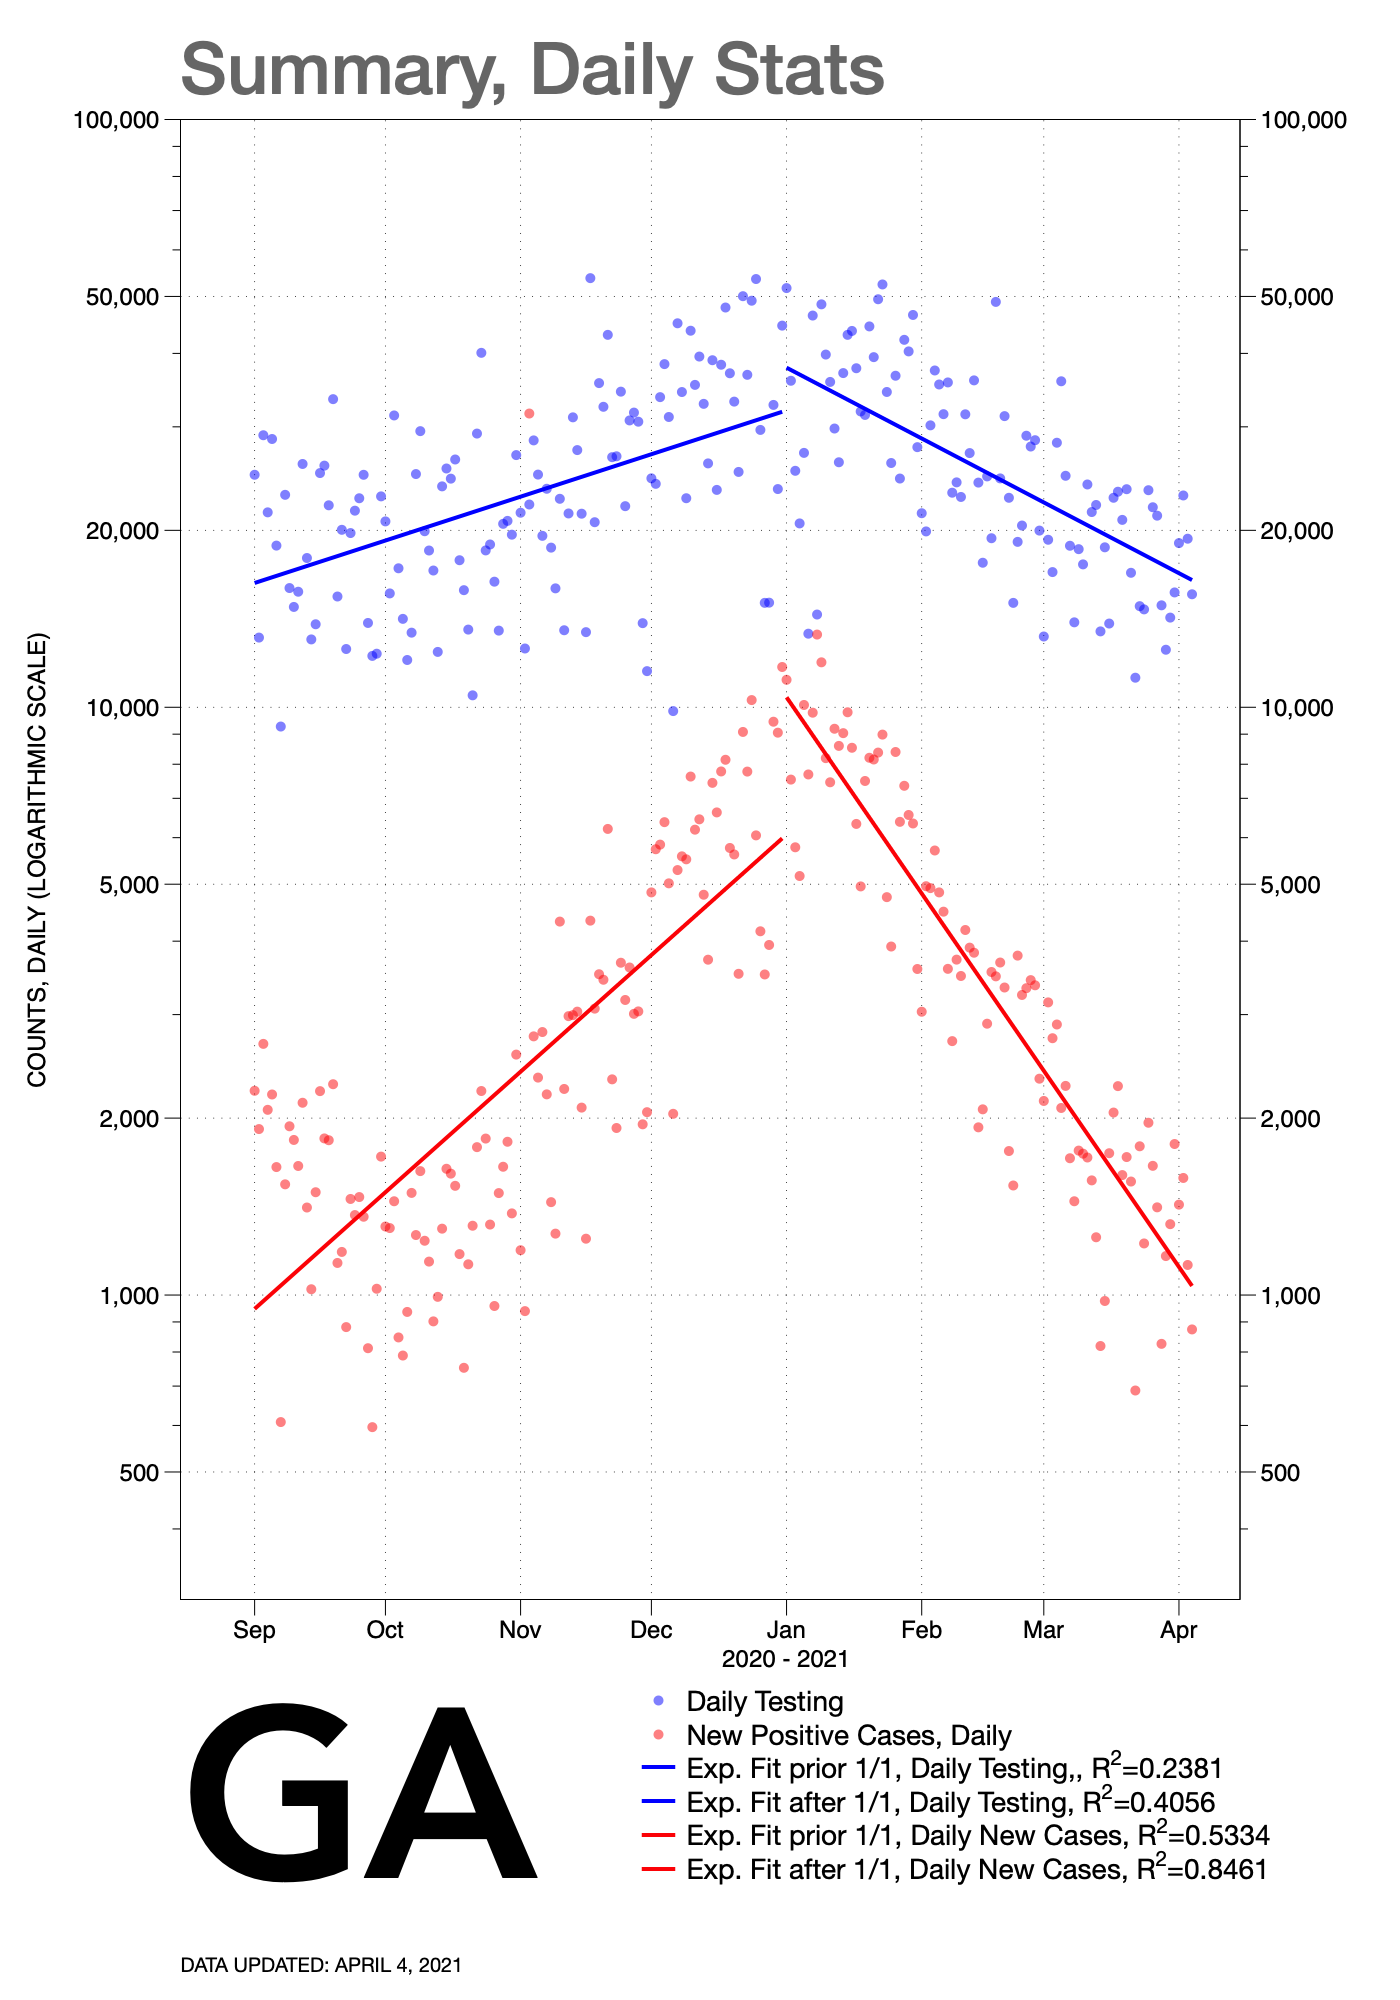
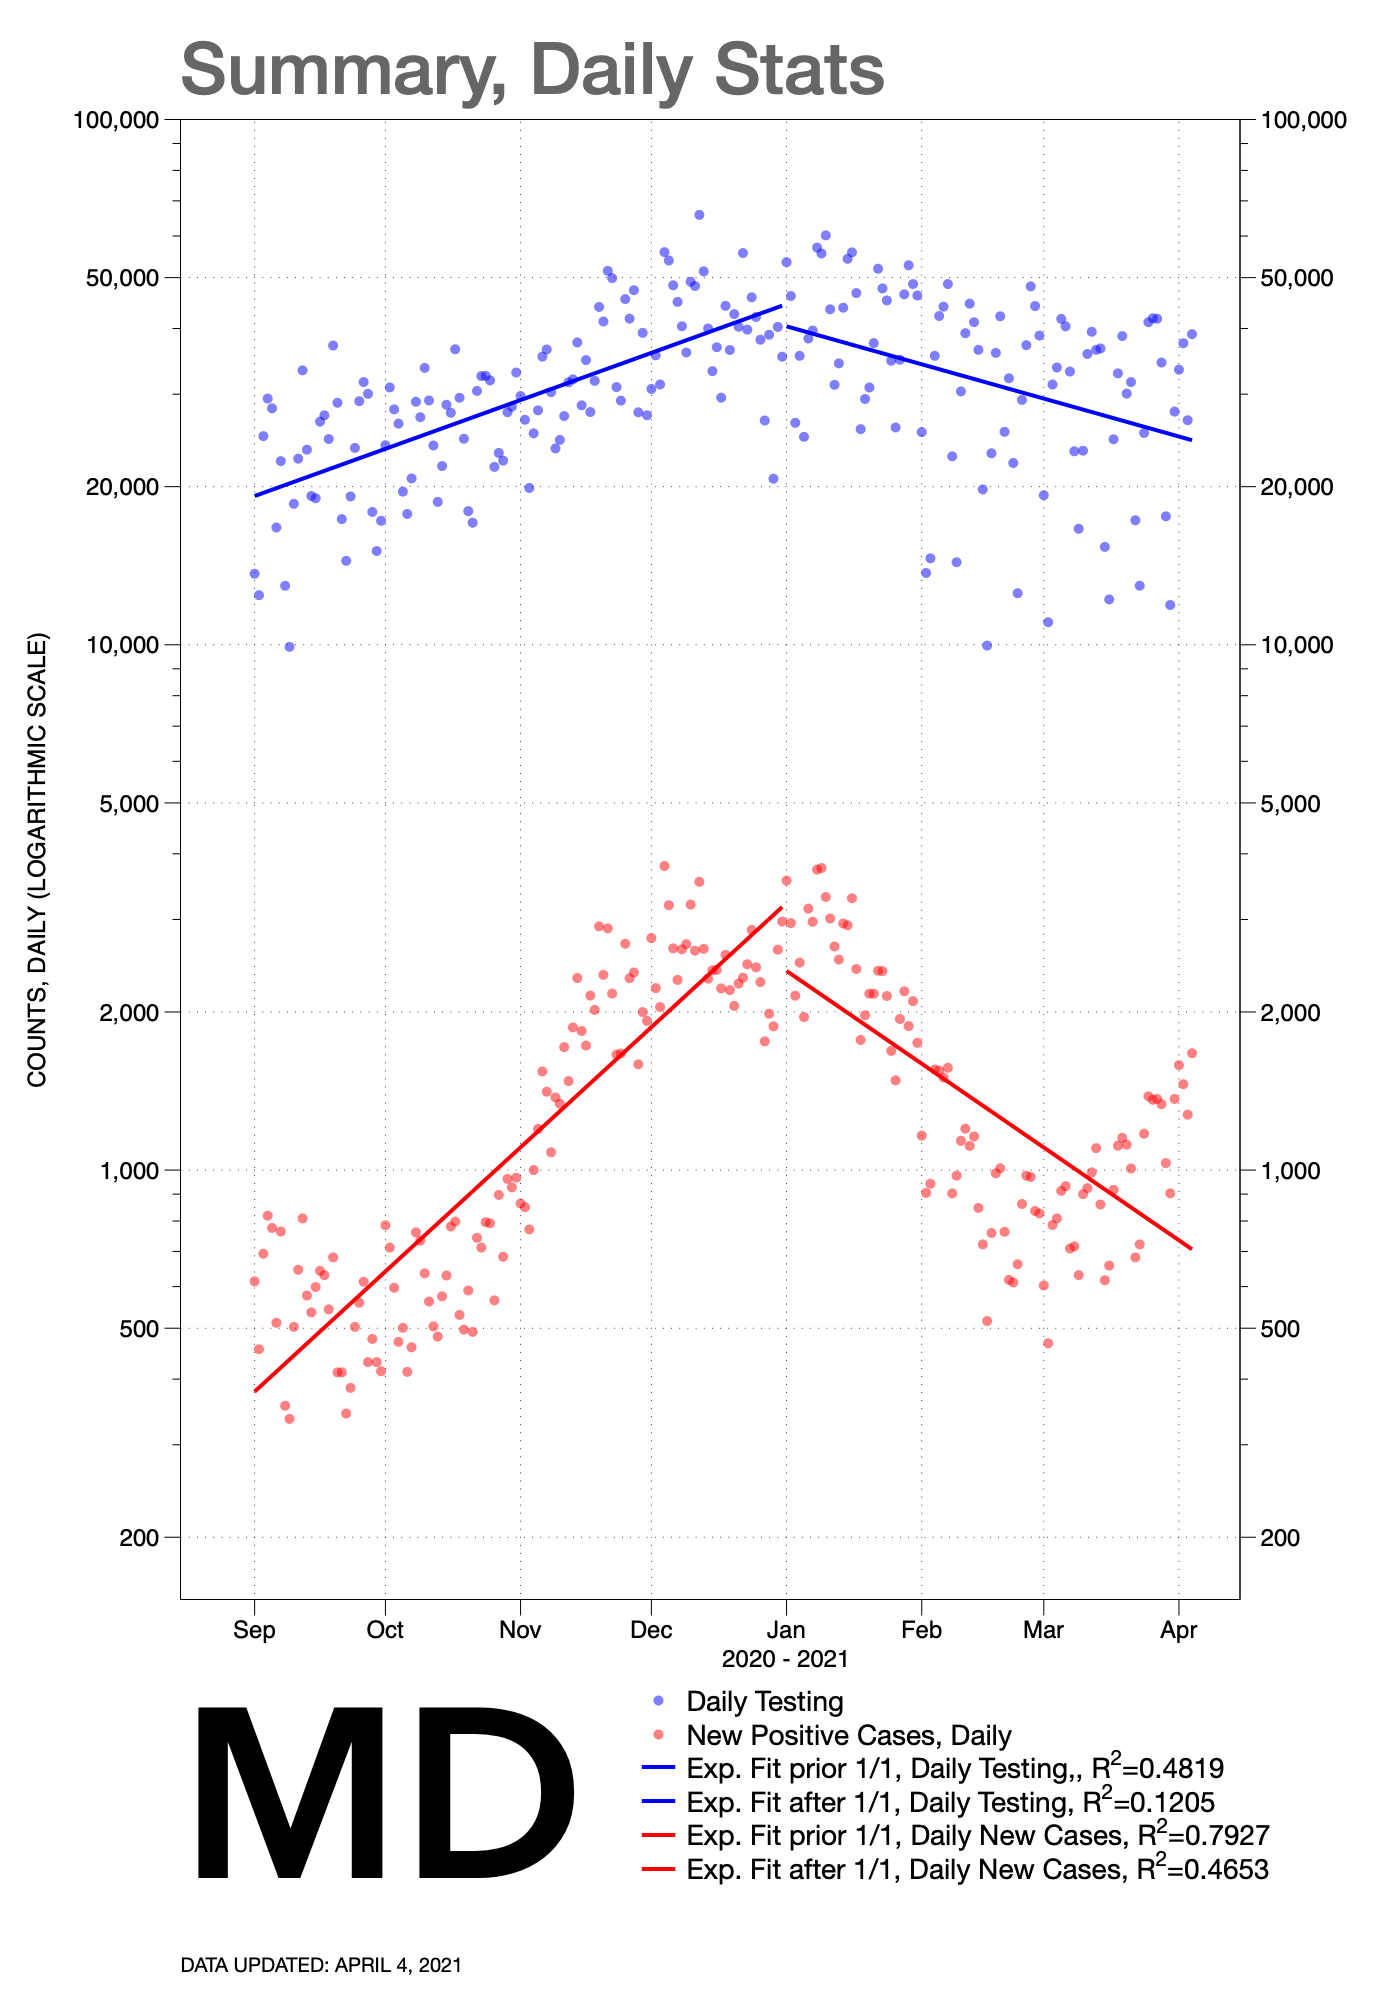
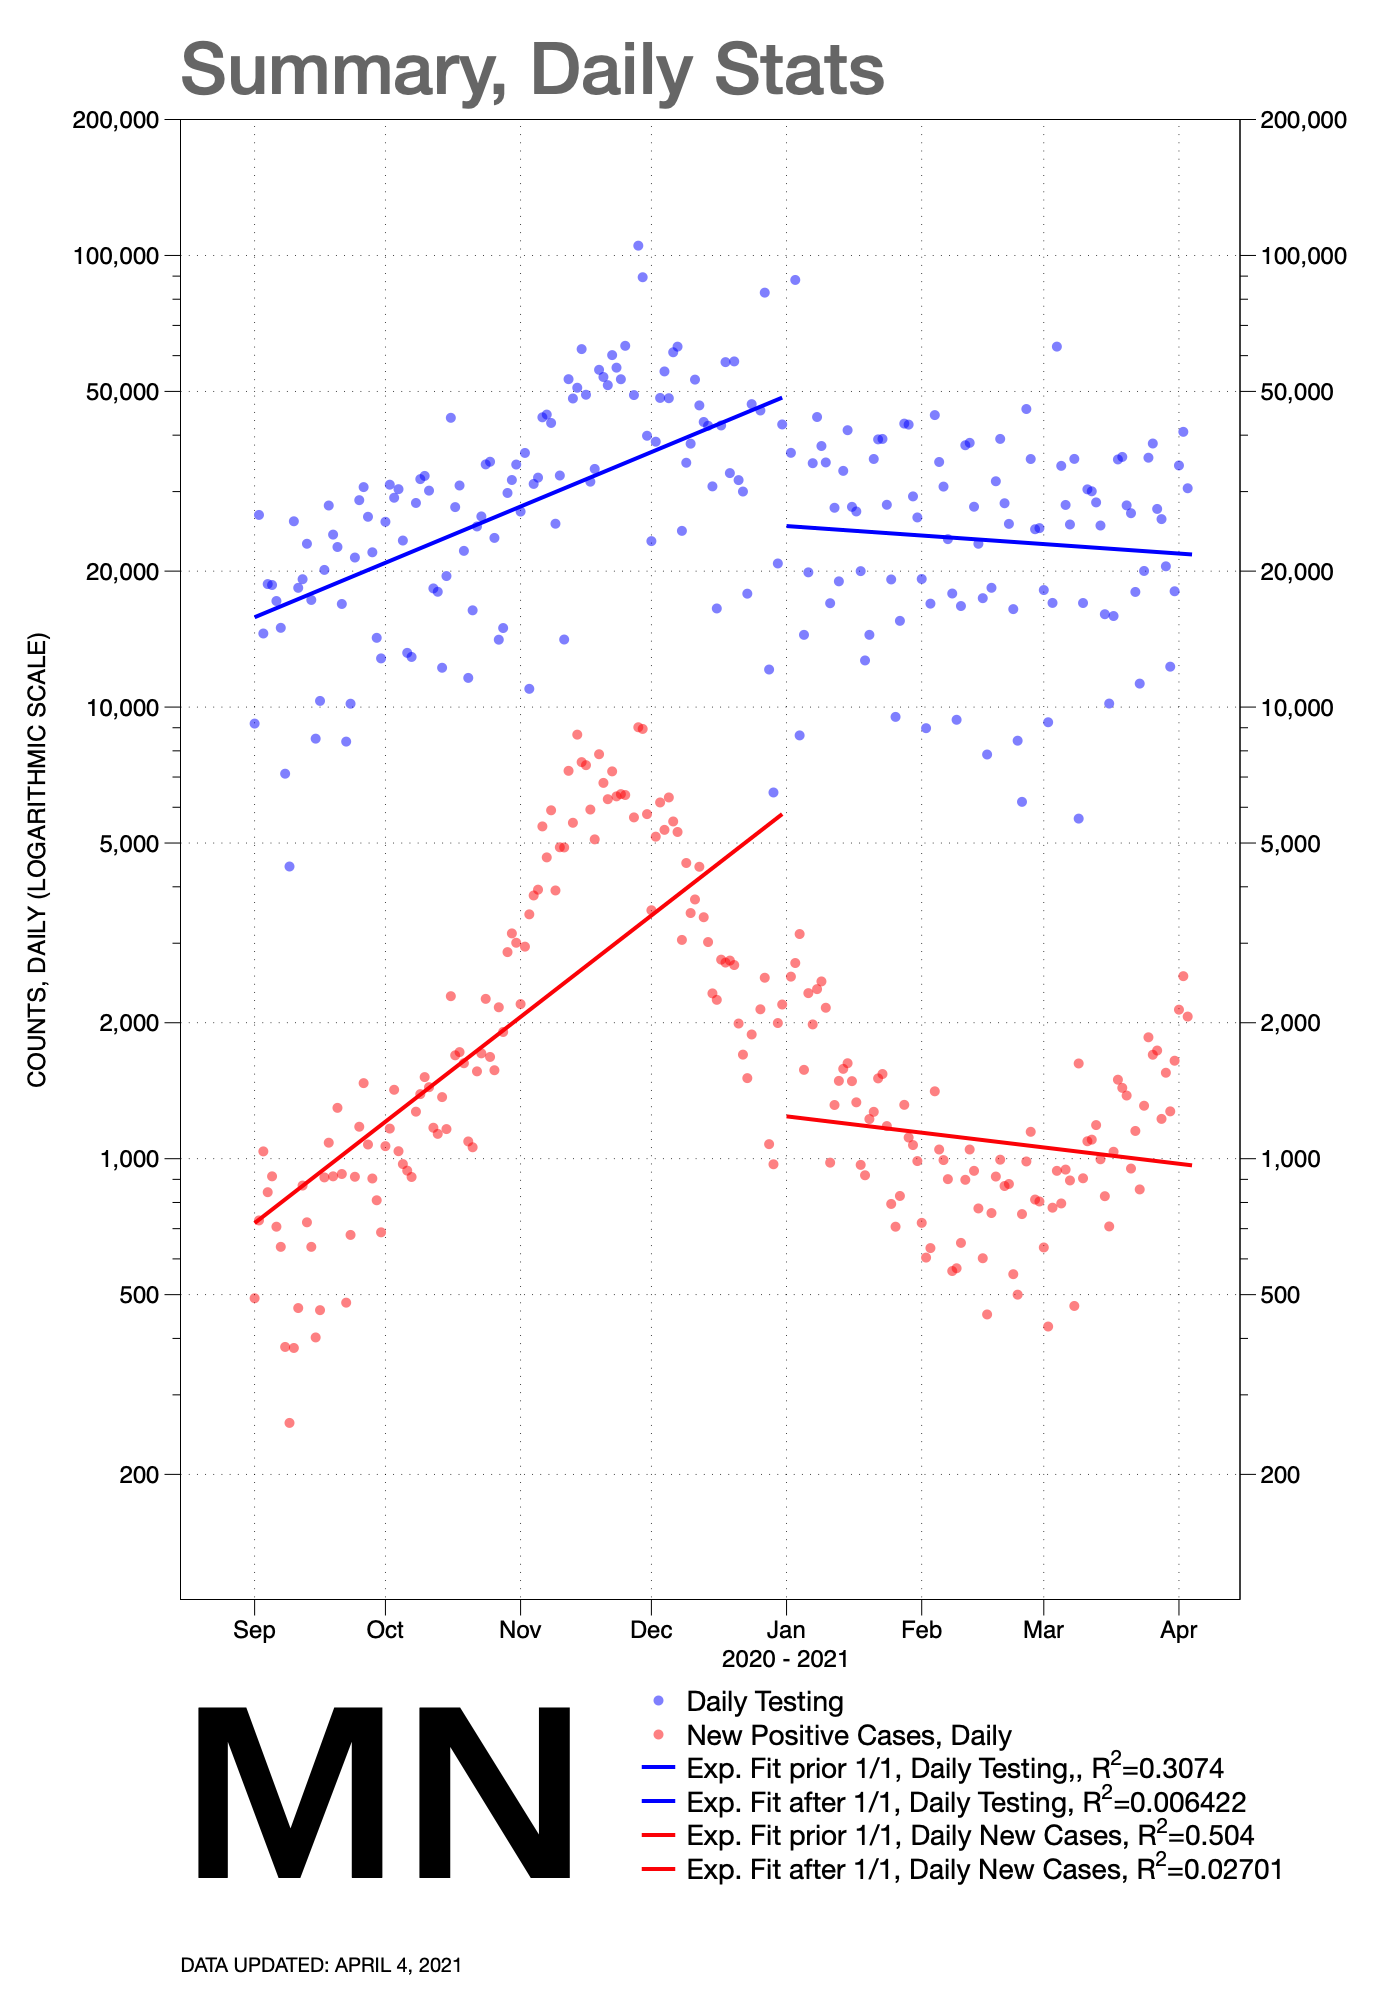
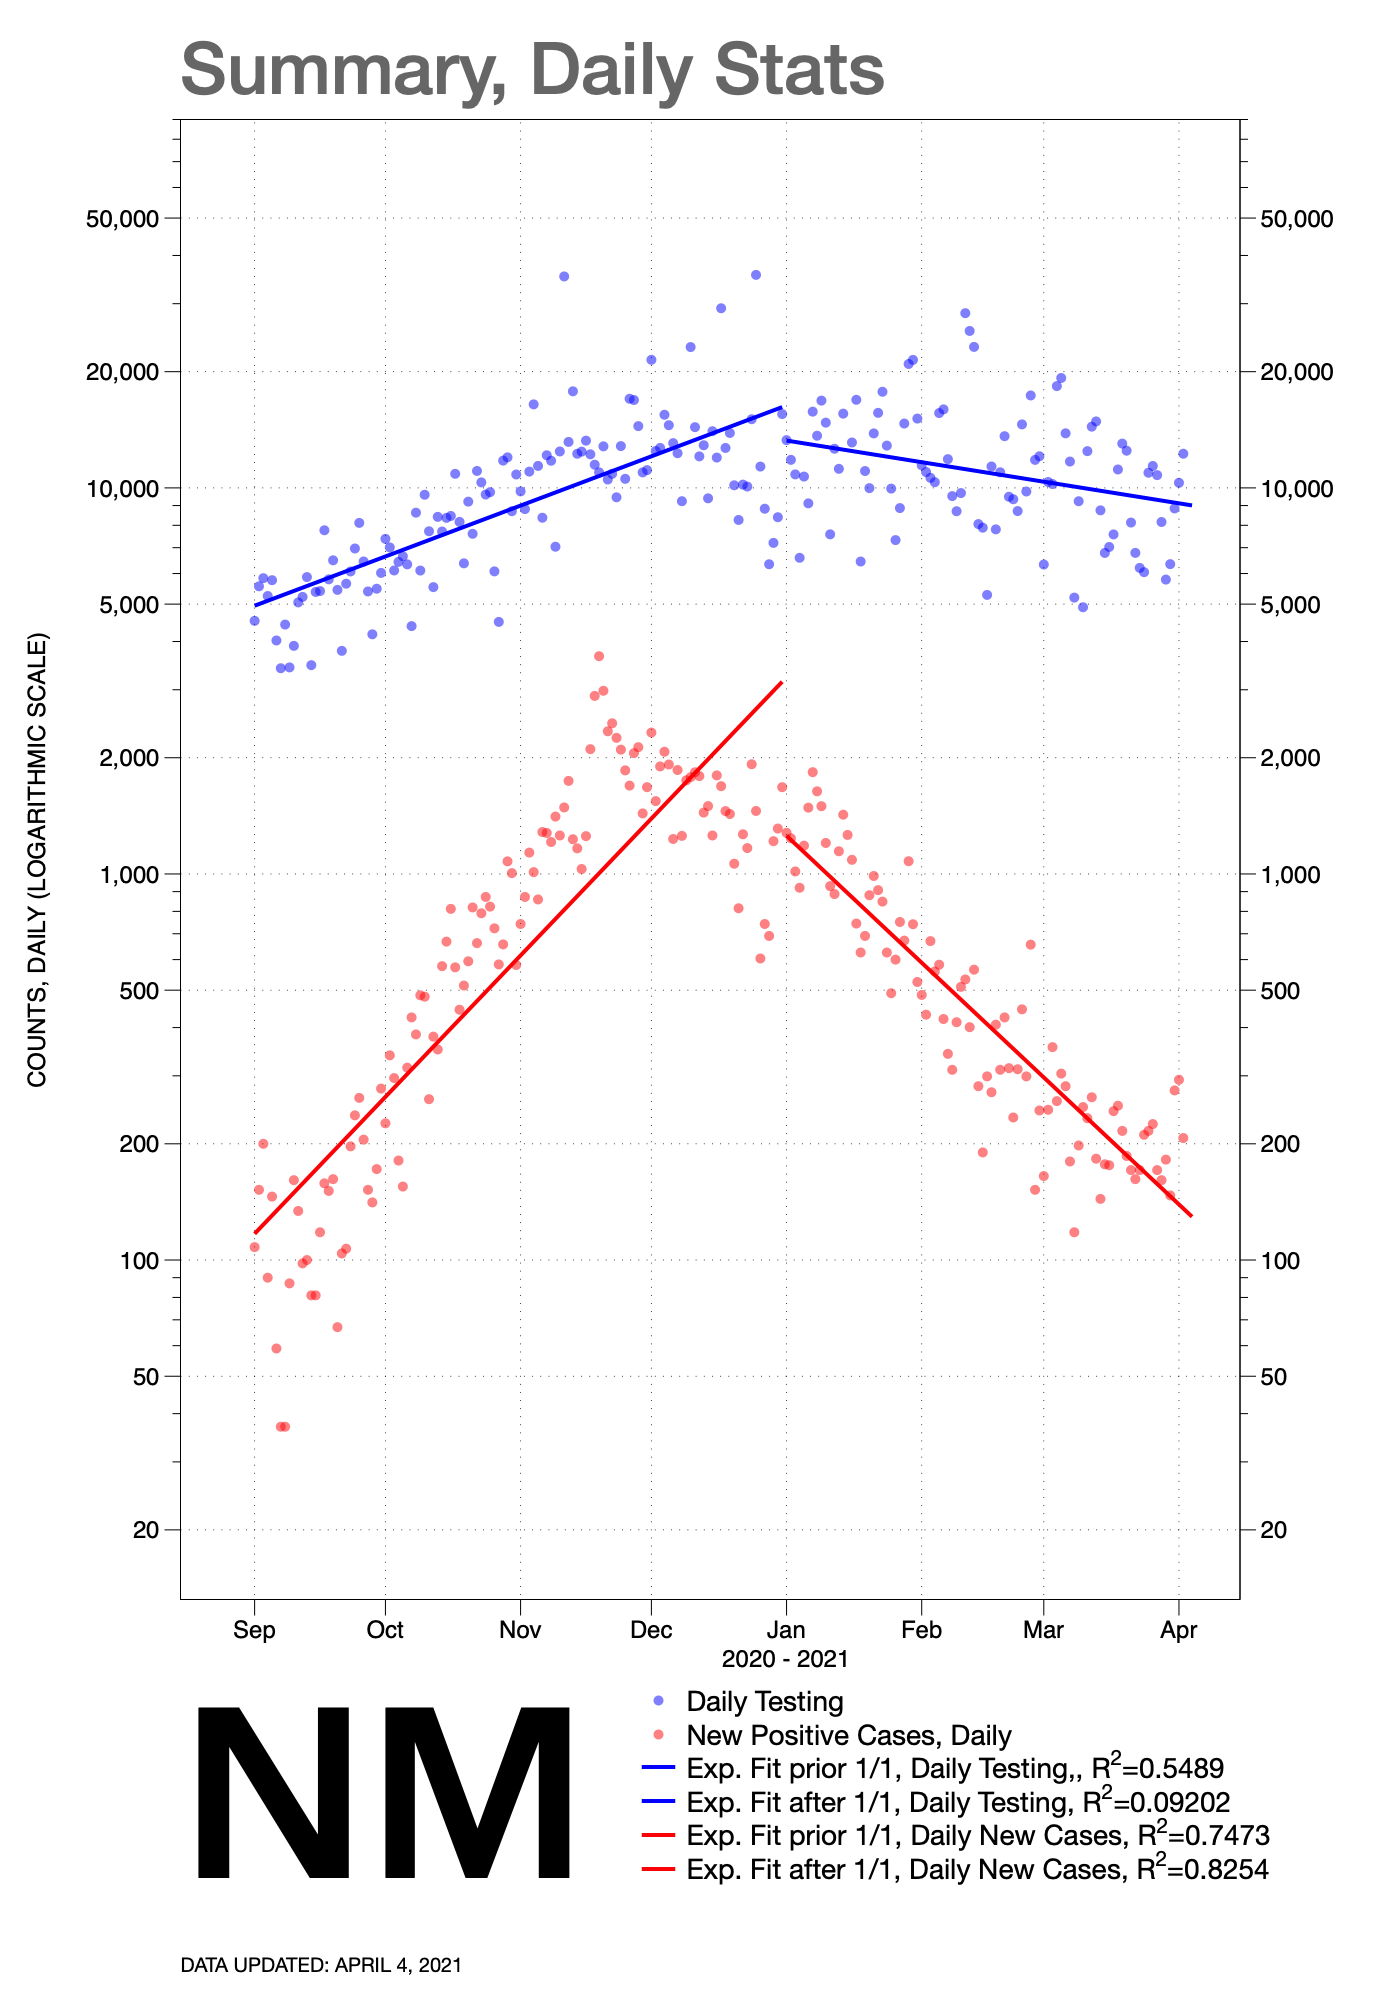
The following charts compare the rates of change in state-level testing for the coronavirus to the rates of change for positive cases.
In general, if the lines are converging, the rates of positive cases are increasing when compared to the general rate of new testing. When the lines are roughly parallel, the rates of new cases are similar to the change in rates of new testing. Finally, if the lines are diverging over time, the rate of new positive cases is decreasing when compared to the level of testing over time. This last scenario, of course, is the preferred outcome. The degree of convergence or divergence indicates the relative magnitude of the change.
In general, since the start of the new year, testing for COVID in most states has declined.
There are several exceptions where testing continues to trend higher, including: AK, CT, MA, NY, RI & VT.
The following states show testing levels of their populations to remain relatively steady in the first quarter of 2021: HI, ME, MO, NH, PA & WA.
The remainder of states show declining testing trends, some with relatively minor declines and others with steep declines.
Click on any individual chart to expand it.


keywords: covid; covid 19; testing; cases; trends