
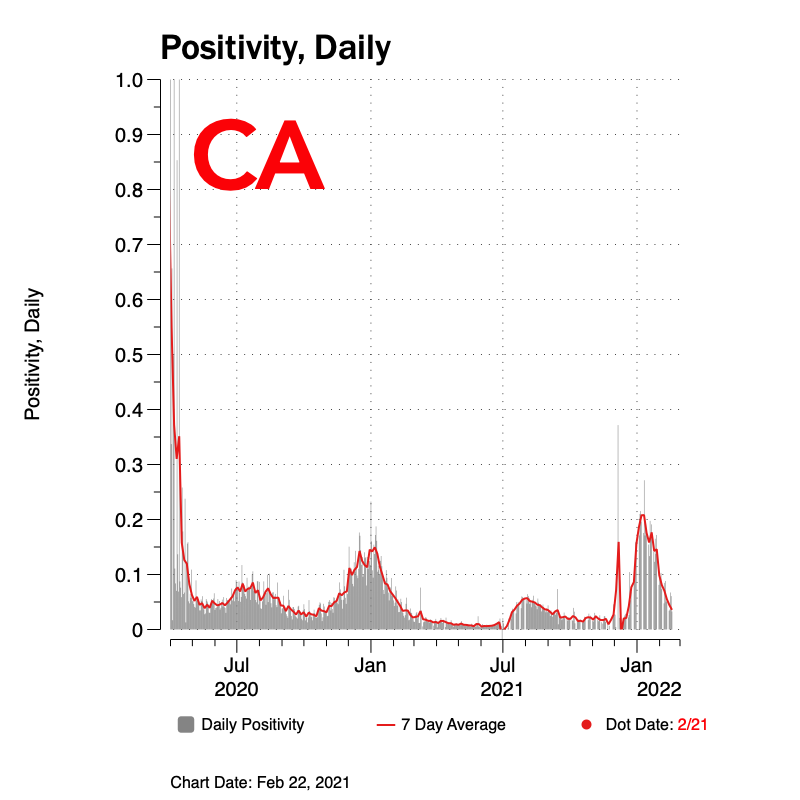
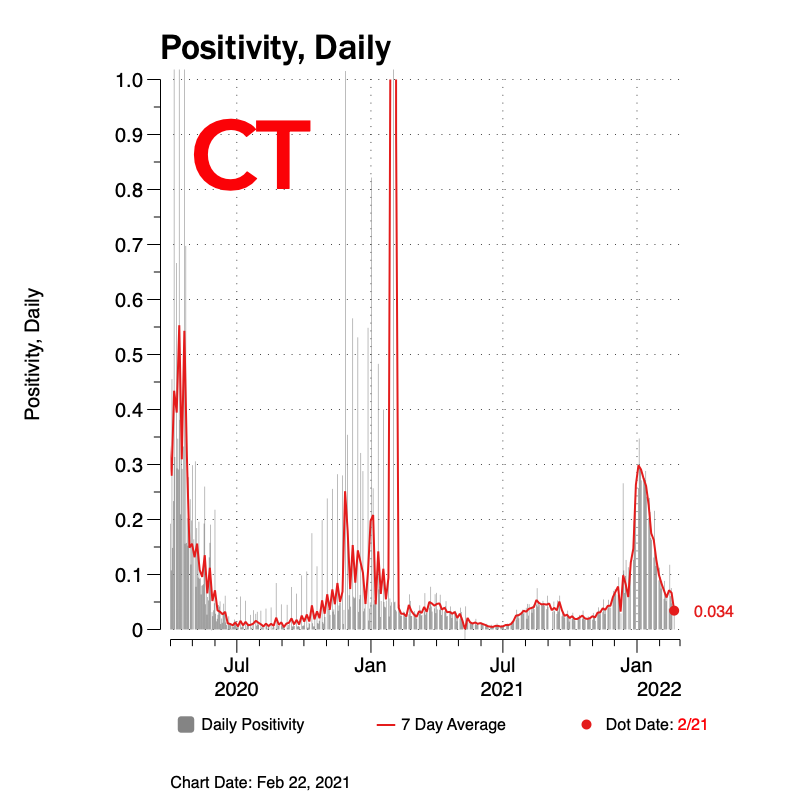
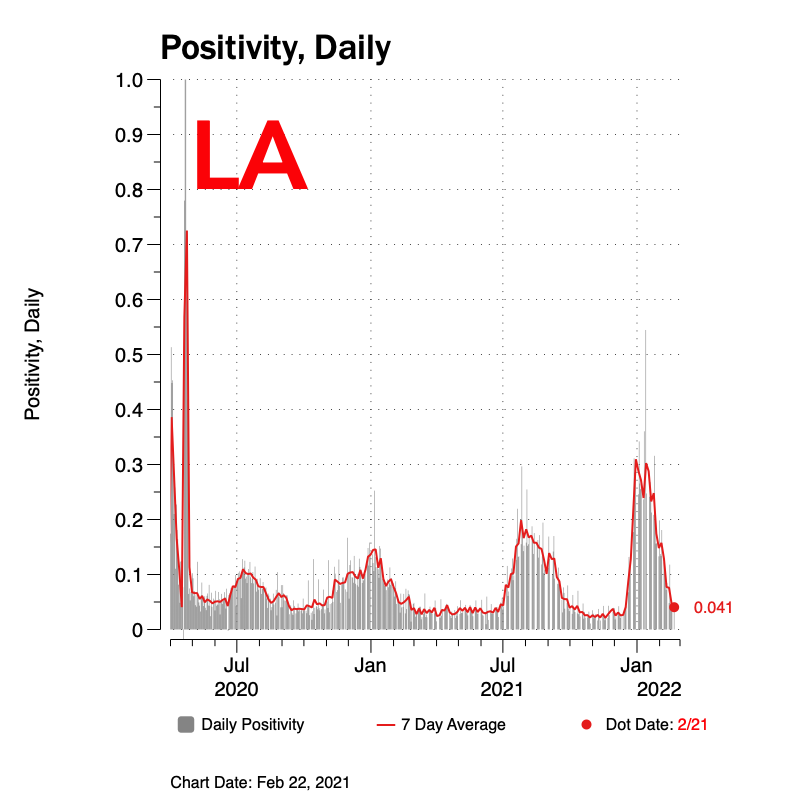
States: Positivity, Daily
February 22, 2022
Data thru February 21, 2022, unless otherwise noted on chart.
Return to the Covid Index page.
The following charts show the daily positivity rate for COVID 19 testing for each state and the District of Columbia. The state names are initialized and are presented in alphabetical order.
Positivity defined here is:
positivity, daily = (daily count of all positive cases) / (daily count of all tests)
Click on any individual chart to expand it.


…
Notes:
It does not appear all states have the same fidelity of daily data, with some having clear spikes even after a smoothing curve has been applied. Some of these spikes are likely due to corrections being made to the data at some point after the date the data was collected for.
States without a number shown for the last data point may not update their COVID statistics on a daily level any longer. Some states have switched to weekly updates. Charts shown on this page updated on days which do not sync with these states weekly updates may have no daily data for those states.
keywords: covid, COVID19, positive, testing, cumulative, states, u.s., united states, positivity, daily
DATA SOURCES: The COVID data is provided by John Hopkins University (JHU) School of Medicine and used in accordance with a Creative Commons CC BY 4.0 License.
Prior to JHU, the COVID data was provided by the COVID Tracking Project (CTP) at The Atlantic and used in accordance with a Creative Commons CC BY 4.0 License. The CTP ceased updating data on March 7, 2021. Further updates were continued by JHU.