
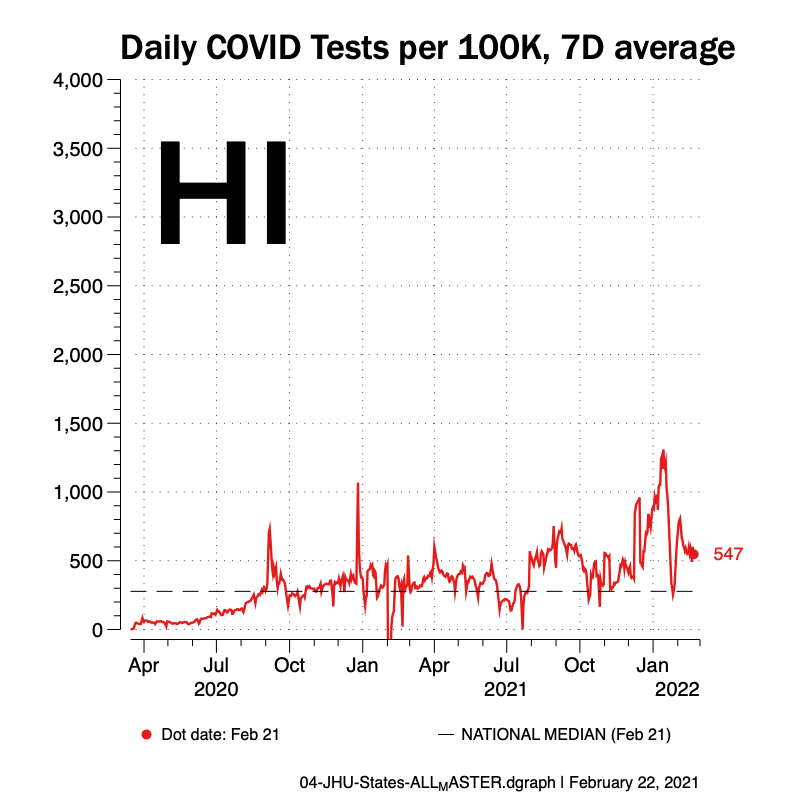
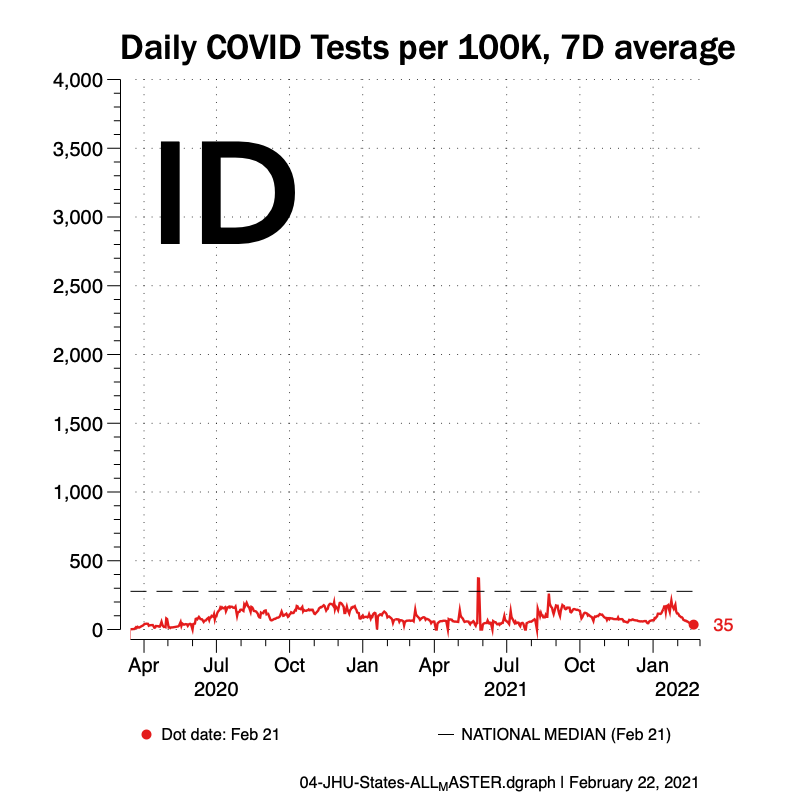
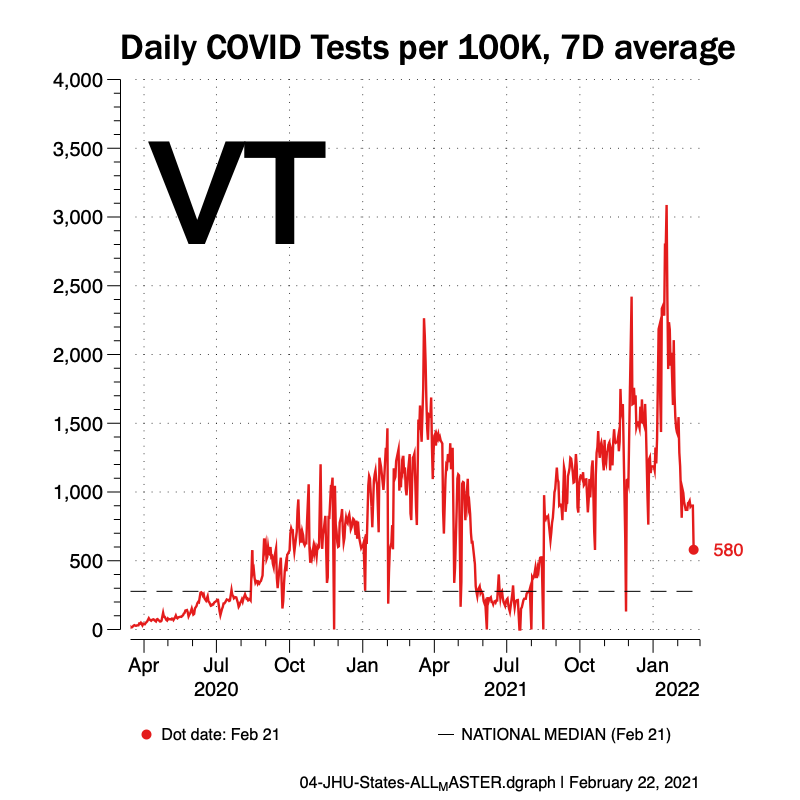
Daily Tests per 100K Population, by State
February 22, 2022
Data thru February 21, 2022, unless otherwise noted on chart.
Return to the Covid Index page.
The time-series plots below show new COVID testing occurring each day. A seven-day smoothing curve has been applied to the trendlines. Point data reflect the most recent date value. The data has been adjusted for population.
—-
Notes
A number of states have discontinued reporting COVID data on a daily basis. Therefore, many state charts may show the most recent date with zero tests. This daily test number is represented on each chart as the number next to the end data point for each state’s respective data line.
The median line represents the median of the most recent seven-day average of daily testing reported by all states. Taking a median of only the most recent date when many states no longer report daily numbers would provide a highly distorted value for a median.


keywords: covid, COVID19, positive, testing, cumulative, states, u.s., united states,
DATA SOURCES:
The COVID test data is provided by John Hopkins University (JHU) School of Medicine and used in accordance with a Creative Commons CC BY 4.0 License. Prior to JHU, the COVID data was provided by the COVID Tracking Project (CTP) at The Atlantic and used in accordance with a Creative Commons CC BY 4.0 License. The CTP ceased updating data on March 7, 2021. Further updates were continued by JHU.
The state populations used for calculating per capita rates were obtained from the United States Census Bureau. The most recent full year values listed were for July 1, 2019 at the time of this writing. A link to the source data is here.