
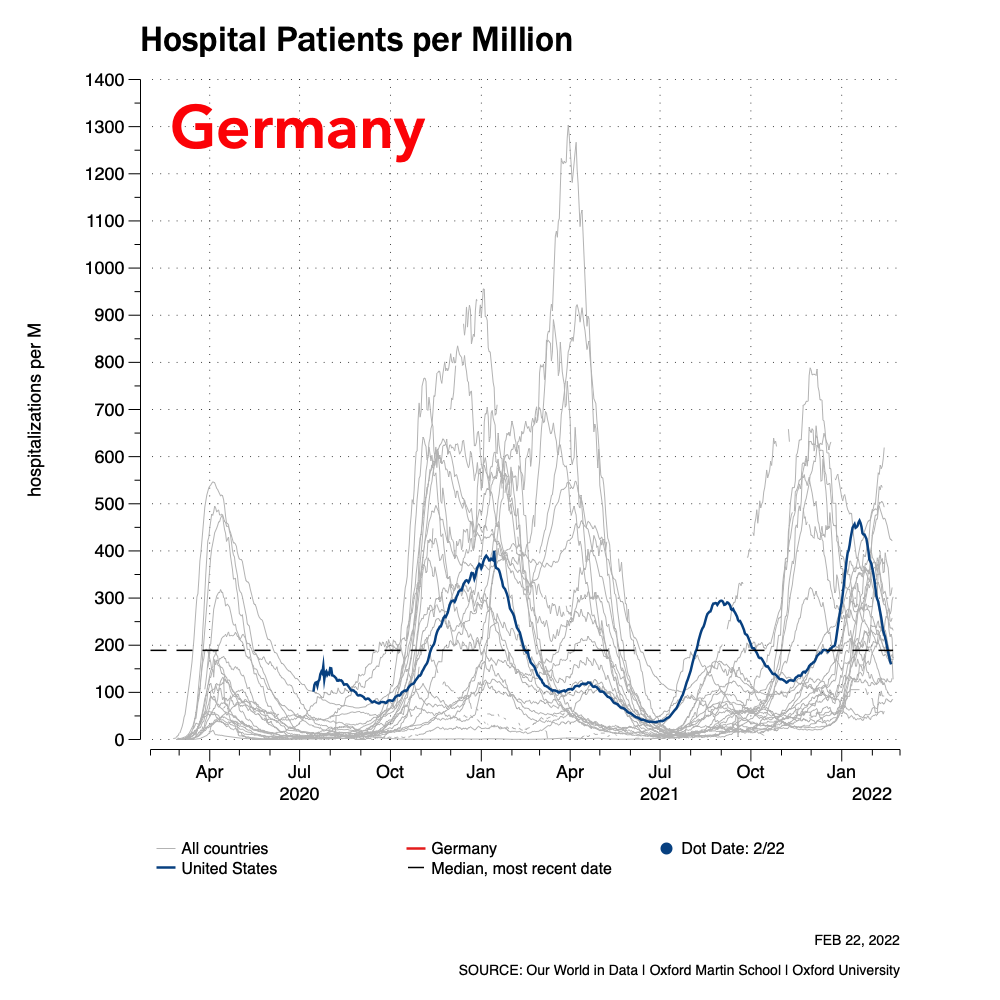
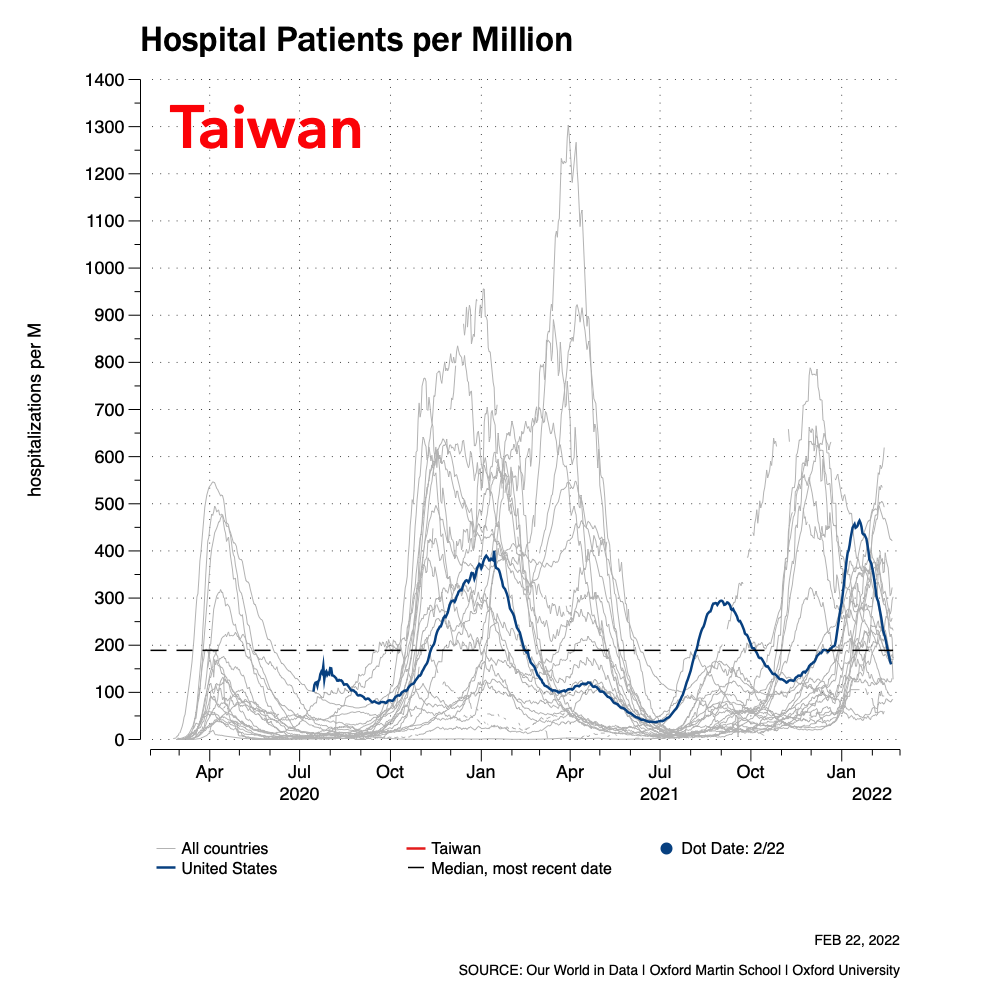
Global: Hospitalizations per Million (Population)
February 23, 2022
Data thru February 22, 2022, unless otherwise noted on chart.
New Chart Series
The time-series charts below show the current rate of hospitalized patients for COVID-19 per million people. The countries shown are the same countries for the other charts in this series. Not all countries report consistent hospitalization data.
U.S. data is shown for comparison on each individual chart. U.S. data is represented by the blue line.


DATA SOURCE:
Data for these visualizations and charts was downloaded and used from Our World in Data (OWID) and is used under a Creative Common CC-BY license granted by OWID.