
New COVID Tests per Thousands, Select Countries
February 23, 2022
Data thru February 15, 2022, unless otherwise noted on chart.
Note: Testing data always appears to be reported several days, and up to a week or more late.
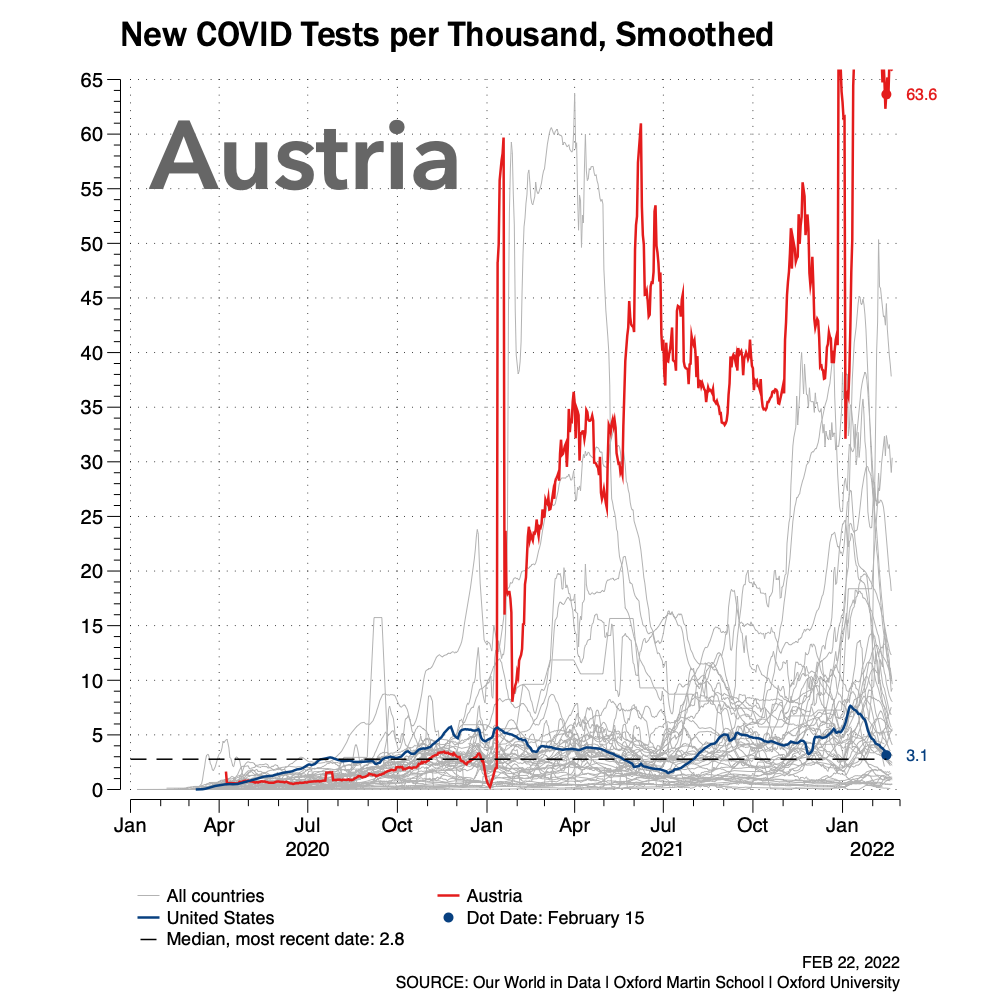
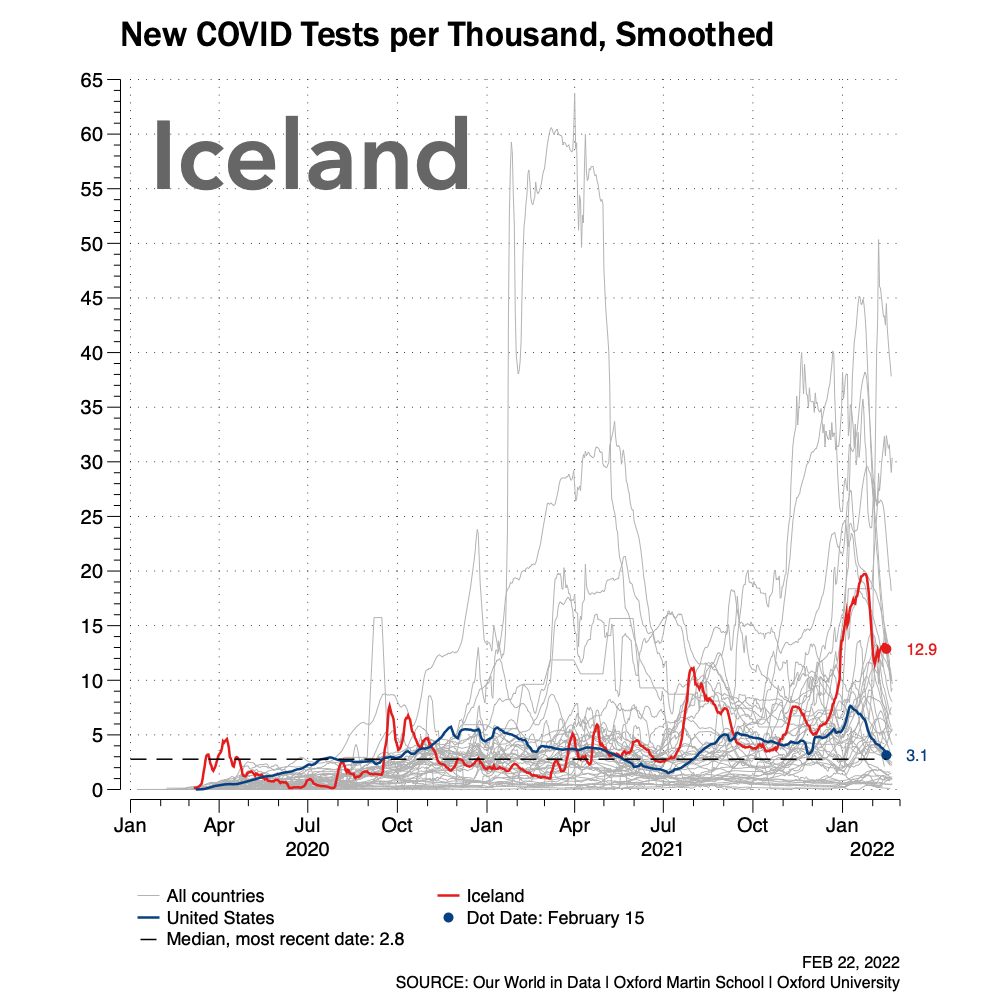
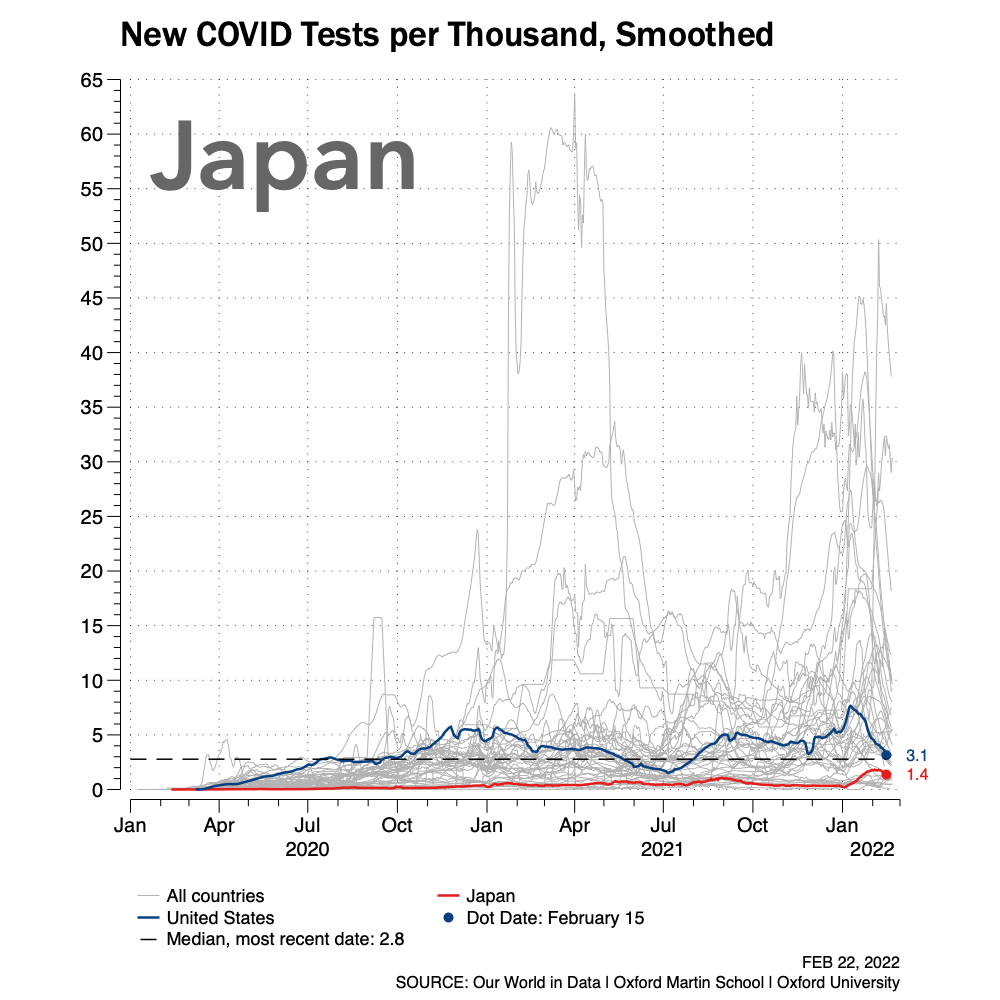
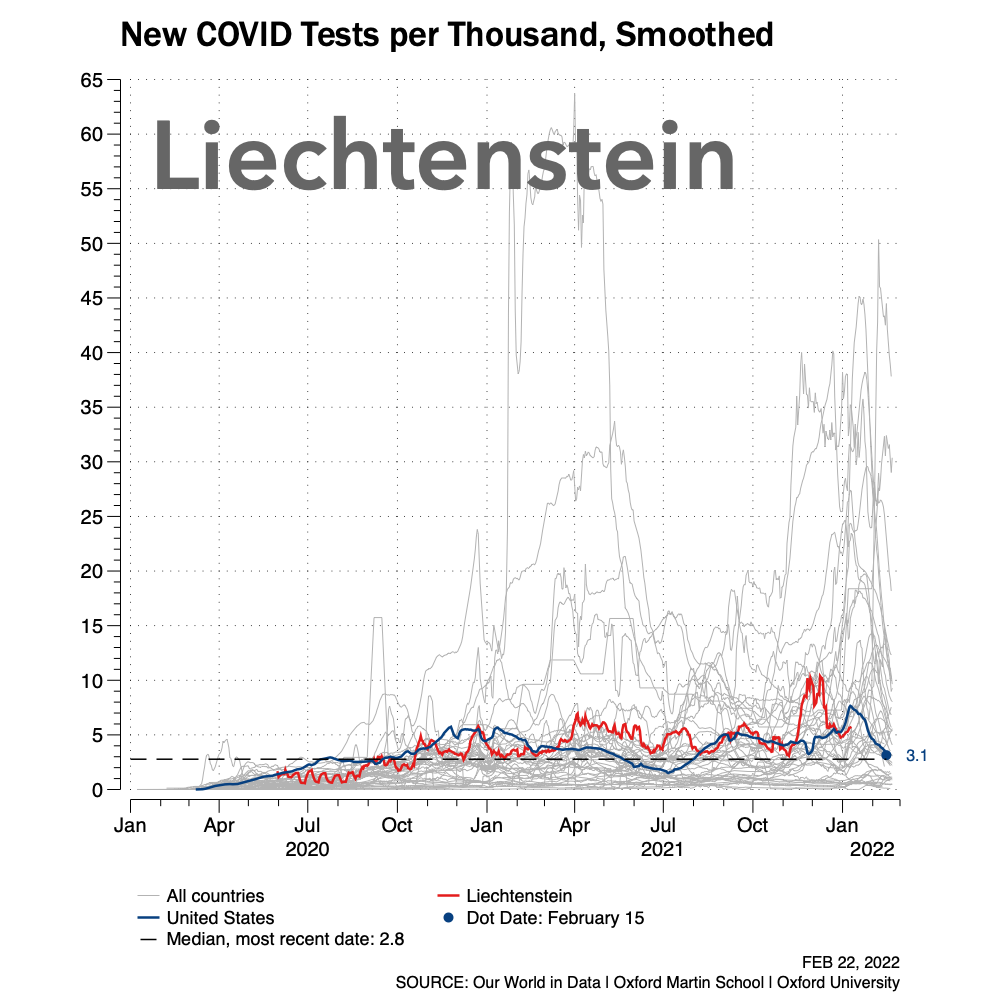
A limited number of trend charts for new COVID tests per thousands of people by country are shown below. Each chart also includes a plot of a red line for a single country and a reference blue line for similar data for the U.S. The plotted light gray lines represent all countries for which data exists, which is most.
A median line for all countries for the most recent date is also present in most charts.
Many countries have data plotted to the date shown above. However, for certain metrics – including the COVID Testing data shown in this series of charts – an earlier date might be highlighted in the charts by the presence of a dot and numerical value associated with it on the data line. This “dot date” is the most recent date which most countries being plotted present data. Lines not showing a dot value means that country has not reported data for the select date.
This is an initial publishing of select countries. There are too many countries to publish charts for every country.
…
NOTE: Test data availability seems to trail the current date by several days. Most of the other global charts presented on this site tend to have data updated to the previous day the chart is published.
Also, update dates vary considerably by country.


DATA SOURCES:
Data for these charts was provided, downloaded and used from Our World in Data (OWID), Oxford University and is used under a Creative Common CC-BY license granted by OWID.