
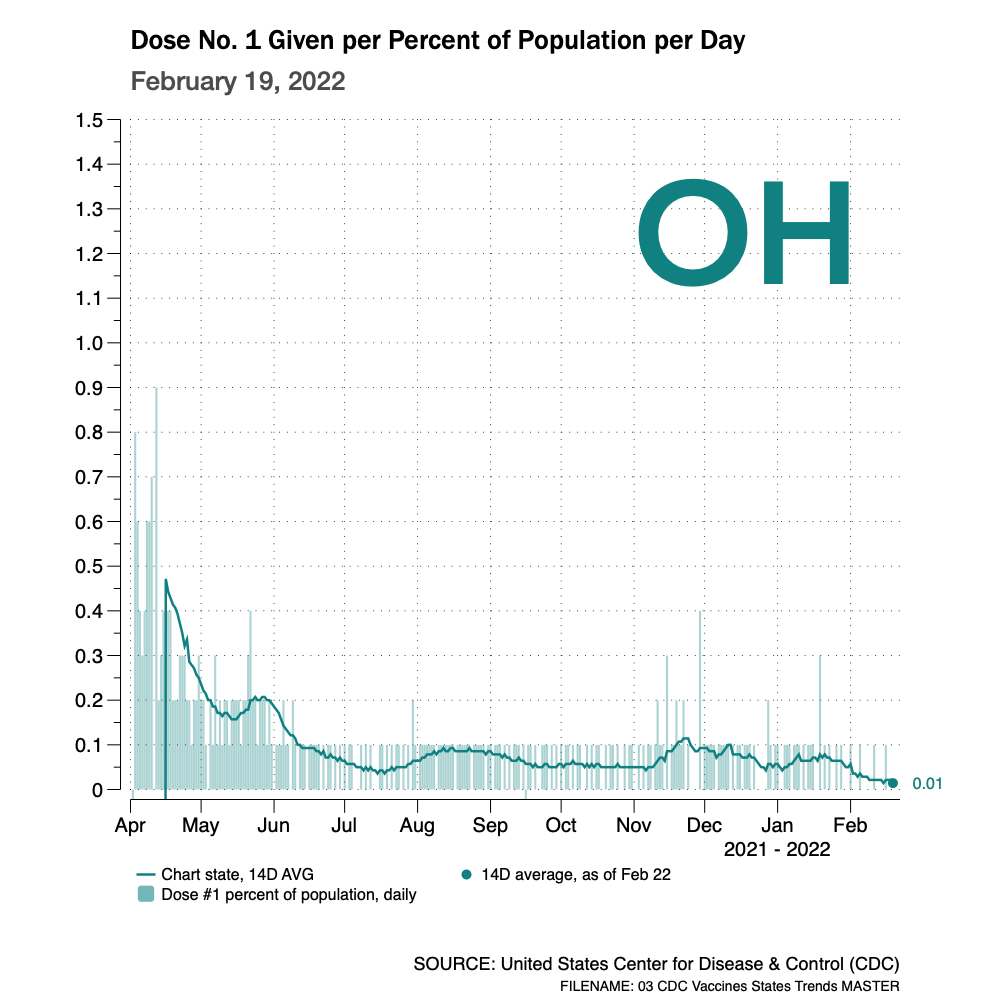
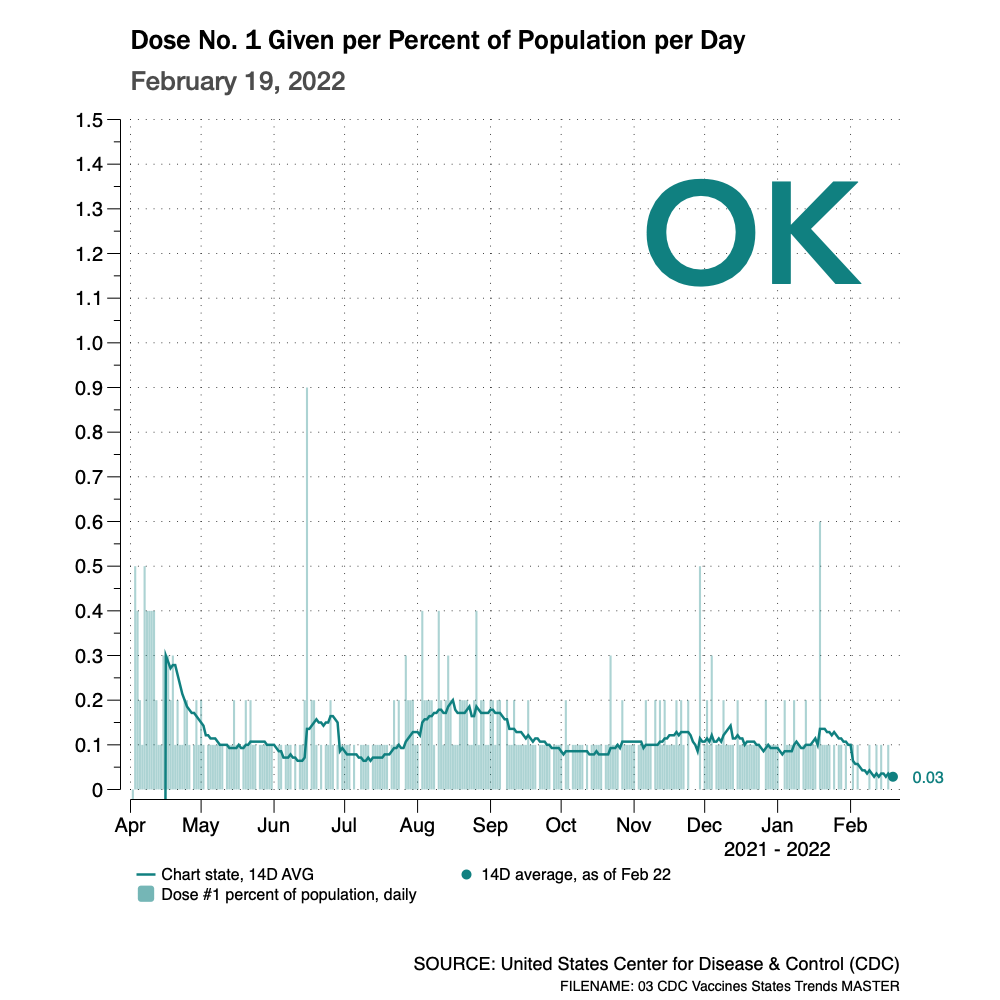
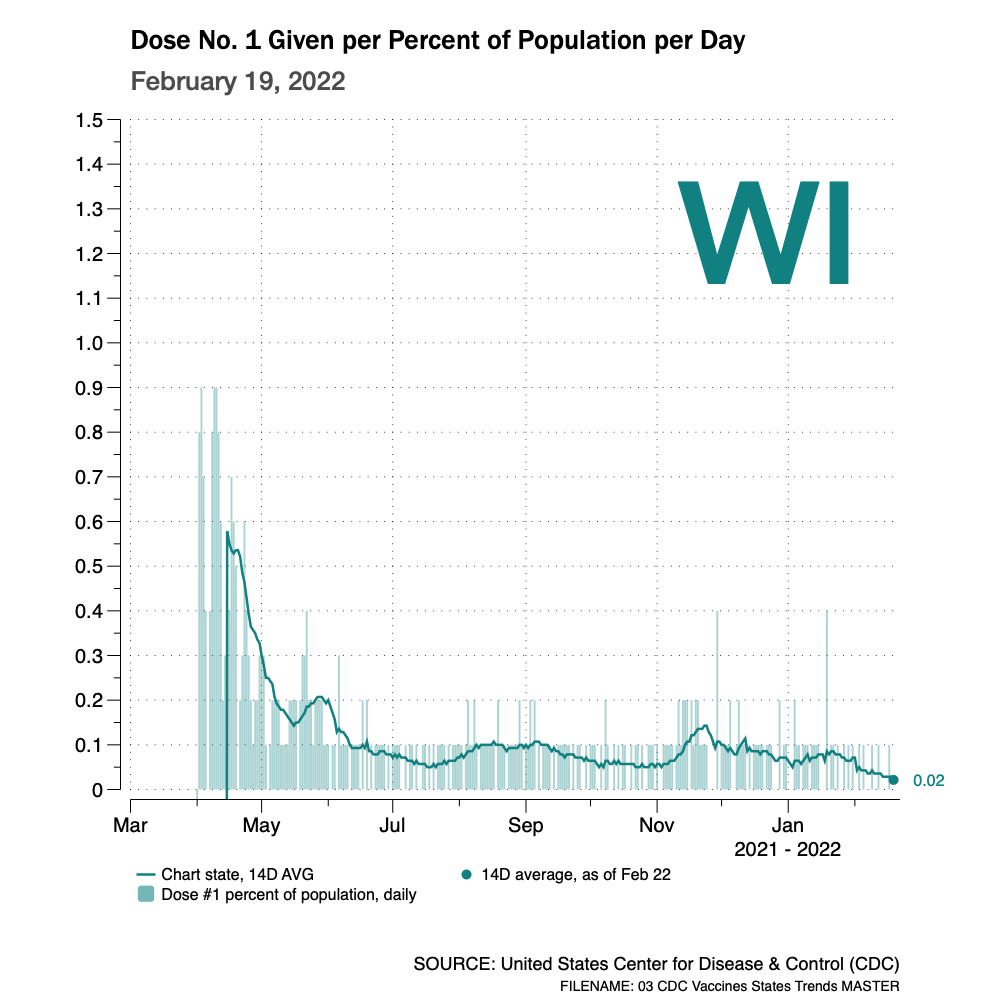
Percent of State’s Population Receiving the First Vaccine Shot, Daily
February 22, 2022
Data thru February 22, 2022, unless otherwise noted on chart.
Return to the Covid Index page.
The following charts show the daily 14-day average percent of each state’s population receiving the first COVID vaccination shot (Dose 1). The state names are initialized and are presented in alphabetical order.
Click on any individual chart to expand it.


keywords: vaccination; dose 1; first dose; daily; United States; U.S. states; District of Columbia
Data Source:
The vaccine data is provided by the United States Center for Disease Control and Prevention (CDC).