
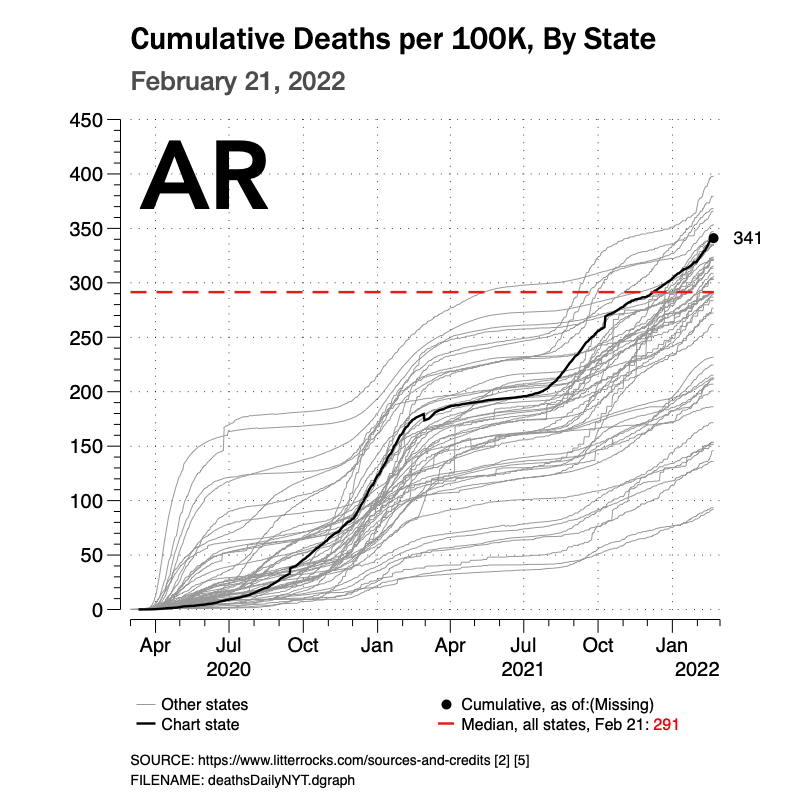
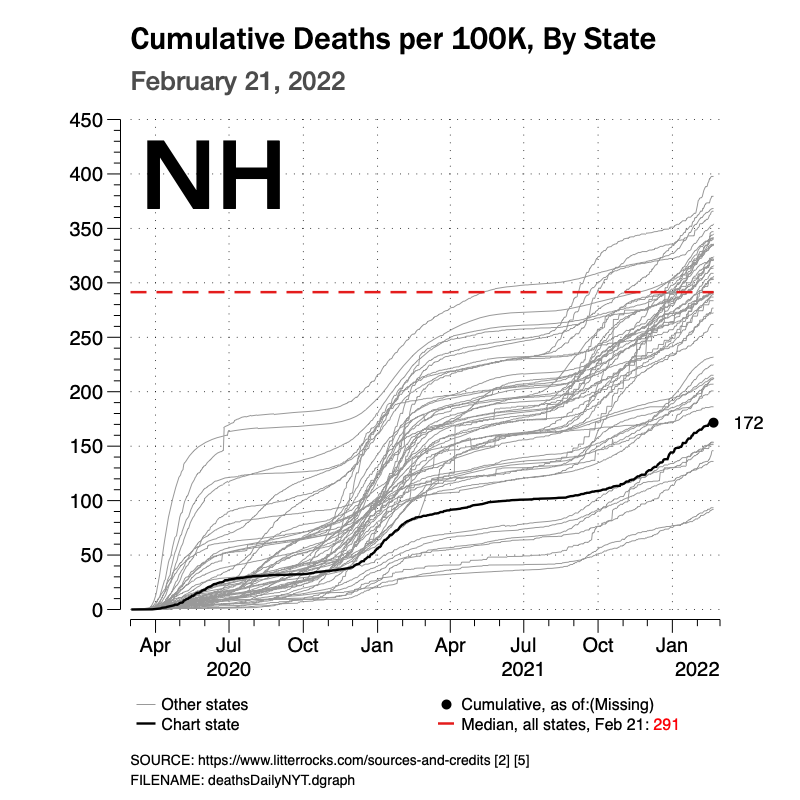
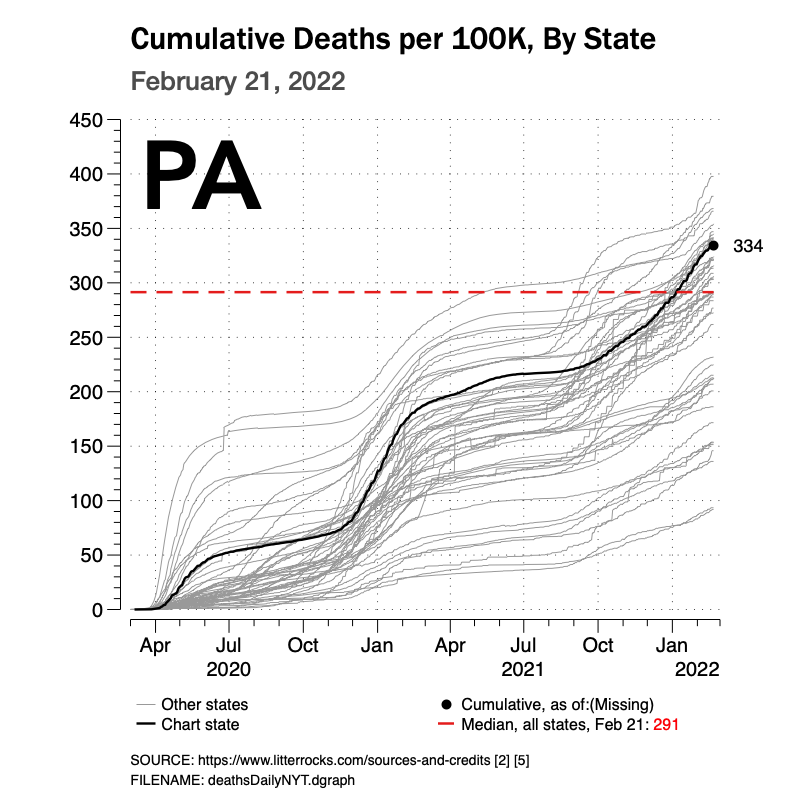
Cumulative COVID Deaths per 100K Population
February 22, 2022
Data thru February 21, 2022, unless otherwise noted on chart.
Return to the Covid Index page.
The charts below show cumulative deaths from COVID by state adjusted for population (per 100K people).


Data Source:
U.S.-level COVID data for cases & deaths on some charts is provided by The New York Times, based on reports from state and local health agencies. It is used in accordance with The New York Times and with the Creative Commons Attribution-NonCommercial 4.0 International license.
The state populations used for calculating per capita rates were obtained from the United States Census Bureau. The most recent full year values listed were for July 1, 2019 at the time of this writing. A link to the source data is here.